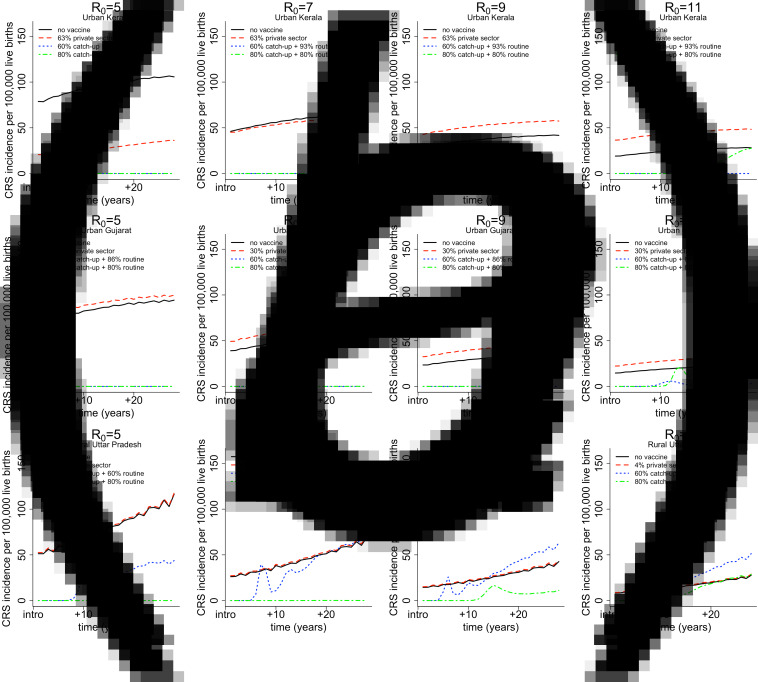
Fig. 4.
Results of simulated rubella dynamics by assumed R0 values across columns for (a) urban Kerala (high coverage, low birth rates) in row 1, (b) urban Gujarat (somewhat average coverage and birth rate) in row 2 and (c) rural Uttar Pradesh (low coverage, high birth rate) in row 3. The figures show CRS incidence per 100 000 live births over time for four vaccination scenarios by assumed R0 values across columns. The solid black lines represents the CRS incidence in the ‘no vaccine’ scenario. The dashed red line represents the CRS incidence in the ‘private-sector vaccine’ scenario; the estimated private-sector RCV coverage (as a proportion) is displayed in the legend for each area per [5]. The dotted blue line represents the CRS incidence in the ‘60% catch-up + routine vaccine’ scenario; the estimated public-sector routine MR coverage (as a proportion) is displayed in the legend for each area per [5]. The dashed and dotted green line represents the hypothetical ‘80% catch-up + 80% routine vaccine’ scenario, which is the critical RCV coverage threshold estimated per [12].

