. 2016 Jun 1;7(9):6153–6159. doi: 10.1039/c6sc01793b

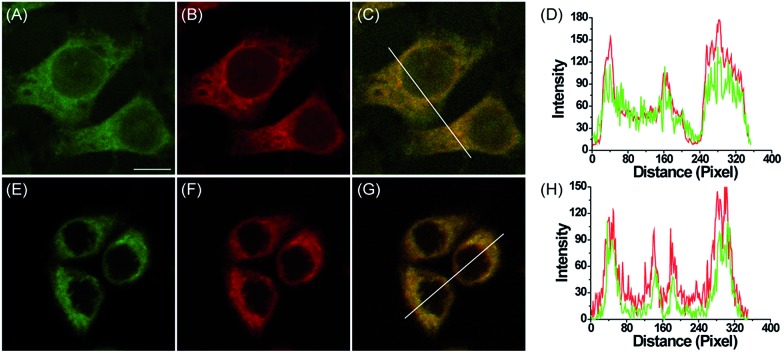
Fig. 2. Confocal fluorescence images of HepG2 cells stained with MI-H2O2 or ER-H2O2 with corresponding commercial organelle-specific dyes. (A) Fluorescence image of MI-H2O2 (10 μM, green channel, Ex = 514 nm, collected 520–580 nm) in cells pretreated with 200 μM H2O2 for 60 min. (B) Fluorescence image of Mito-Tracker Deep Red (0.5 μM, red channel, Ex = 633 nm, collected 640–700 nm). (C) Overlay of (A) and (B). (D) Intensity profile of the white line in image C. (E) Fluorescence image of ER-H2O2 (10 μM, green channel, Ex = 405 nm, collected 500–620 nm) in cells pretreated with 200 μM H2O2 for 60 min. (F) Fluorescence image of ER-Tracker Red (0.5 μM, red channel, Ex = 543 nm, collected 580–630 nm). (G) Overlay of (E) and (F). (H) Intensity profile of the white line in image G. Scale bar: 10 μm.

Fig. 2