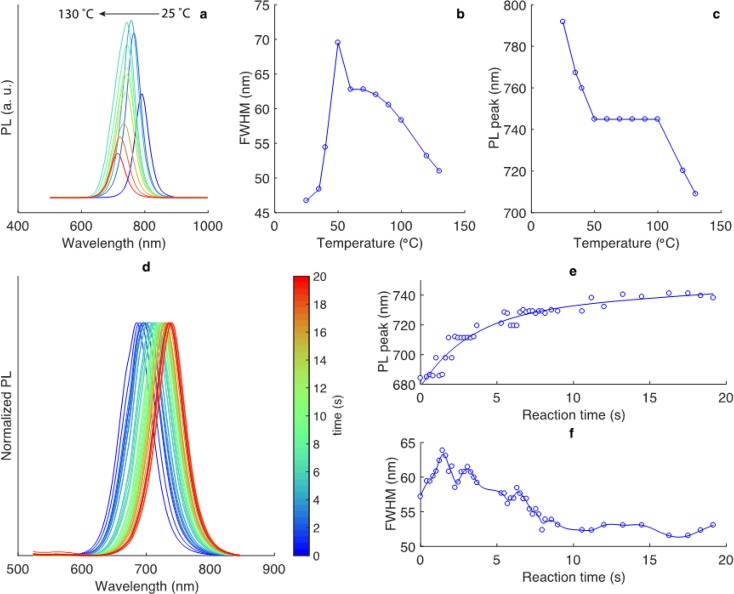
Figure 3.
Microfluidic synthesis of CsxFA1–xPbI3 NCs. Variation in the (a) PL spectra, (b) fwhm, and (c) PL maximum as a function of temperature for Cs0.03FA0.97PbI3 NCs (with the variation in the Cs/FA molar ratio indicated). Other parameters were as follows: FA/Pb = 9.3, Cs/Pb = 0.3, and reaction time = 10 s. (d–f) Temporal evolution of the normalized online PL spectra, PL maxima, and fwhm of Cs0.02FA0.98PbI3 NCs at 80 °C.

