. 2016 May 25;7(9):5879–5887. doi: 10.1039/c6sc00205f

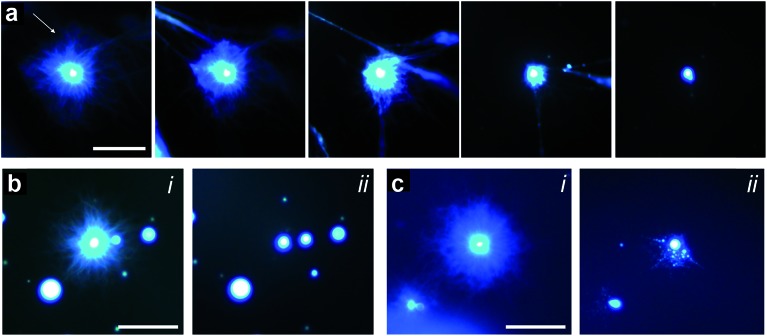
Fig. 5. (a) Epifluorescence images showing reconfiguration of an aster-like structure into a single coacervate droplet induced by addition of sodium hydroxide (final concentration = 20 mM). Left to right; time-dependent images recorded sequentially at 10 s intervals after addition of sodium hydroxide. The arrow indicates the direction of the sodium hydroxide gradient; scale bar = 50 μm. (b and c) Fluorescence microscopy images showing two examples of retraction pathways in nanofibre asters subjected to addition of sodium hydroxide; (i) and (ii) represent images recorded before and after addition of sodium hydroxide, respectively. Scale bars = 50 μm.

Fig. 5