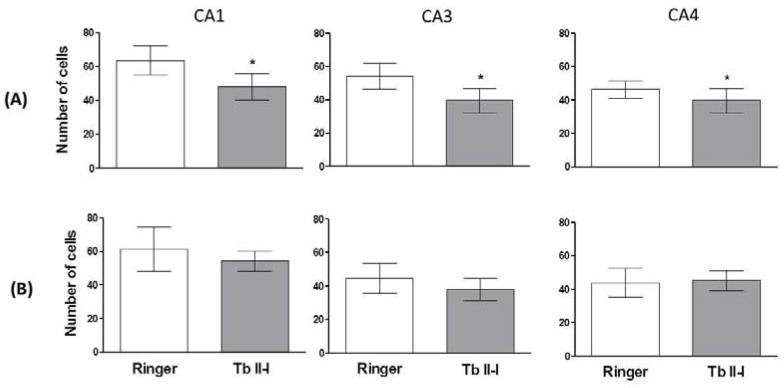
Figure 6.
Histological sections of rat brains (10 μm) analyzed by light microscopy at 400×. The analysis refers to the layer of (A) injected with Tb II-I (2 µg/2 µL) or Ringer’s solution (2 µL) and the (B) non-injected side of the hippocampal areas CA1, CA3 and CA4. Data are expressed as the mean ± SD. * p < 0.05 compared to the control group (Student’s t-test).

