
Figure 7.
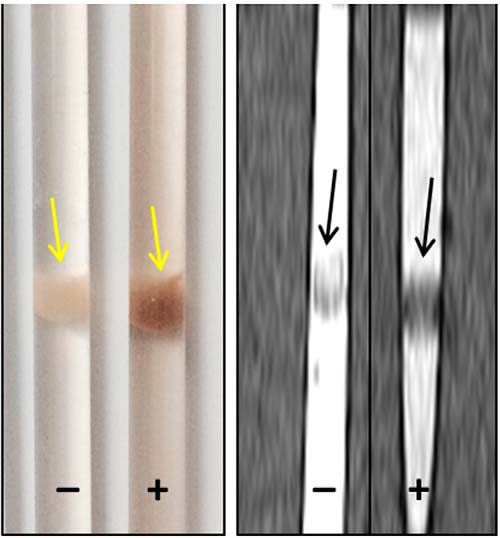
Left: photo of the tubes with no iron and with the iron-loaded cells. The brown layer has cell samples doped in it. Below and above the cells, the water was doped with 1% gel. Right: zoomed sagittal image of the tube showing signal reduction in the region of the iron-loaded cells. “−” means cells that do not express ferritin–EGFP and “+” means cells that express ferritin–EGFP. Both groups of cells were supplemented with iron during the culture process.