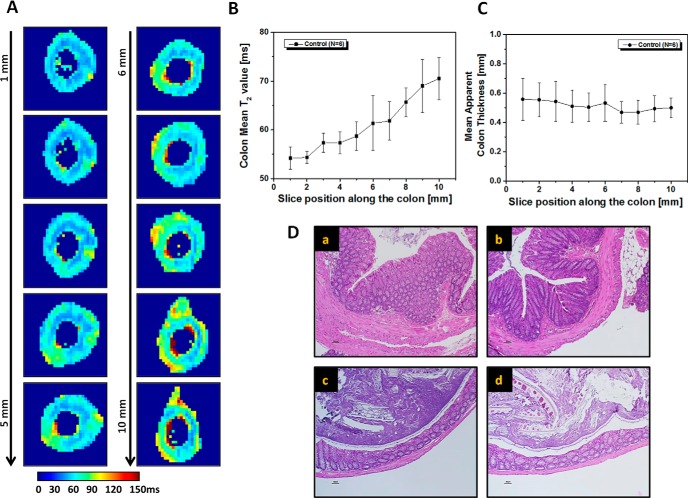
Figure 2.
In vivo MRI colonoscopy of untreated mouse. T2 maps of representative, untreated colon at different sections along the colon (A). The most distal part is labeled as 1 and the most proximal as 10. Colon wall mean T2 values (B) and mean apparent thickness (C) as functions of section position along the colon are presented. Values are reported as mean ± SD. Hematoxylin and eosin (H&E)-stained transverse sections of control colon obtained from 4 different points (a–d) along the imaging area (∼1 cm) (D). The most distal part is shown in (a) and the most proximal part in (d).

