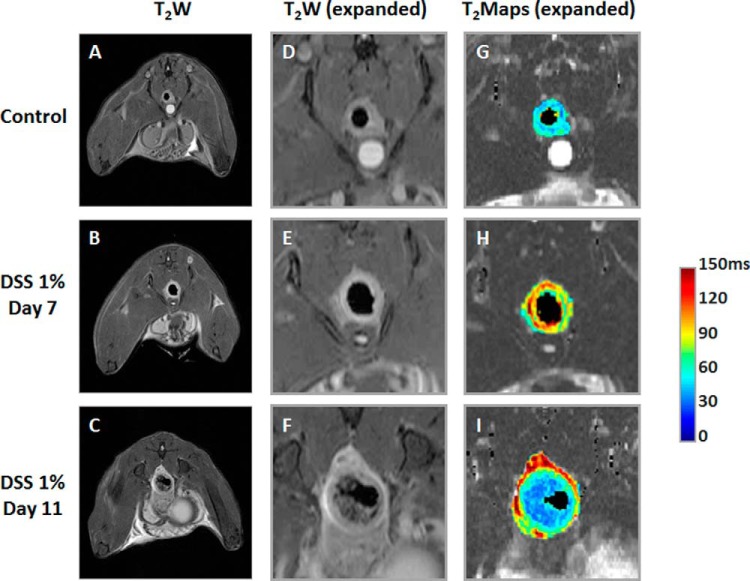
Figure 3.
In vivo colon MRI quantification of untreated and treated mice. The T2-weighted (T2W) magnetic resonance (MR) images (A–C), and corresponding expanded regions, showing T2W images (D–F) and T2 maps (G–I), of a representative untreated mouse and a mouse treated with 1% dextran sodium sulfate (DSS), on post-treatment days 7 and 11, respectively.

