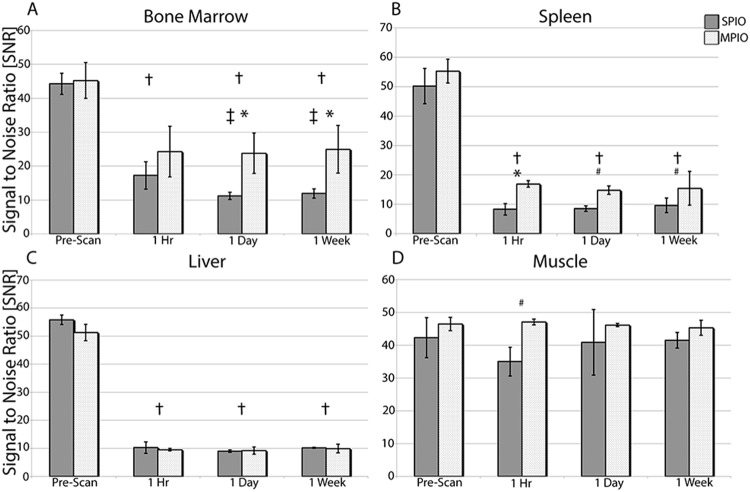
Figure 2.
SNR measurements after IV SPIO and MPIO injections of the bone marrow (A), spleen (B), liver (C), and muscle (D). †P < .05 denotes a significant difference between the prescan and other time points, *P < .01 and #P < .05 denote a significant difference between MPIO and SPIO, respectively, and ‡P < .05 denotes a significant difference in the SPIO SNR measurement compared to the 1-hour time point.

