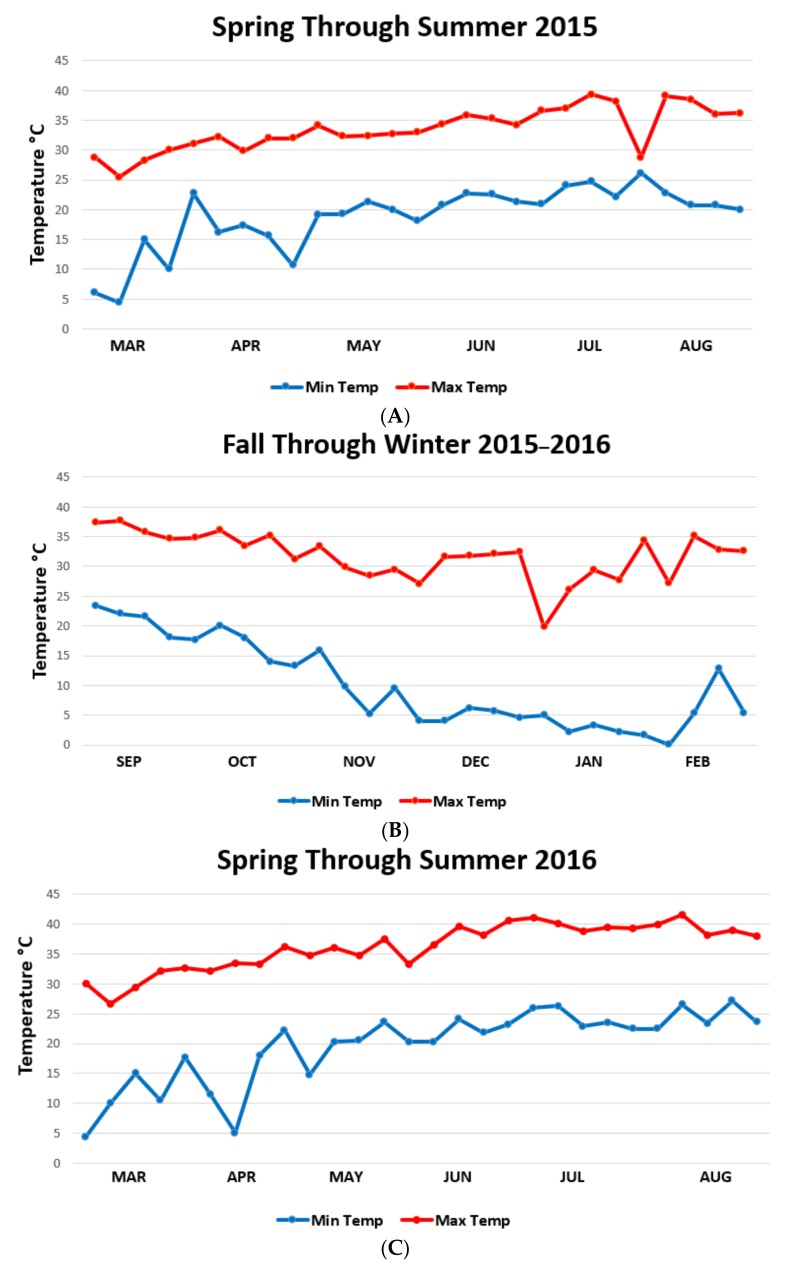
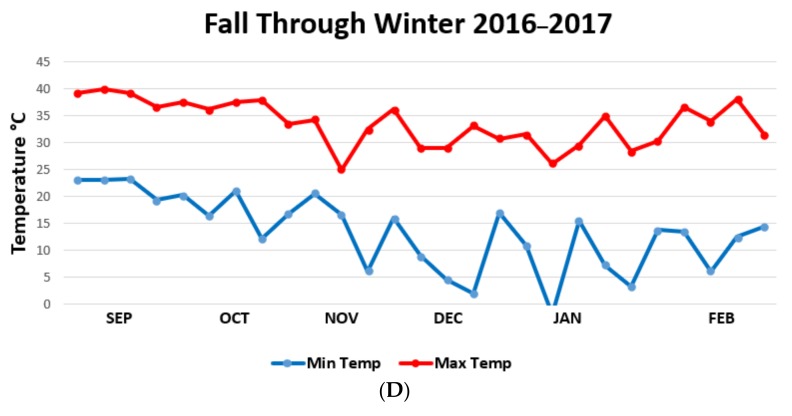
Figure 4.
Mean-max and mean-min weekly ambient temperatures per every six months of sample collection. (A) March in the spring of 2015 to August 2015, next (B), September 2015 through February 2016, then (C), March in the spring of 2016 to August and finally (D) September in the fall of 2016 through February 2016.


