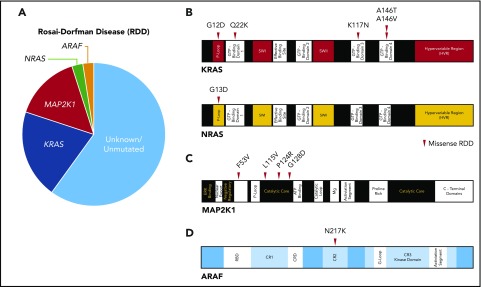
Figure 1.
Summary of the diverse kinase mutations documented in RDD. (A) Pie chart illustrating the known activating kinase mutations in RDD (N = 34). (B) Diagrams of somatic mutations described in KRAS and NRAS. (C) Diagram of somatic mutations uncovered in MAP2K1. (D) Diagram of somatic mutation discovered in ARAF.

