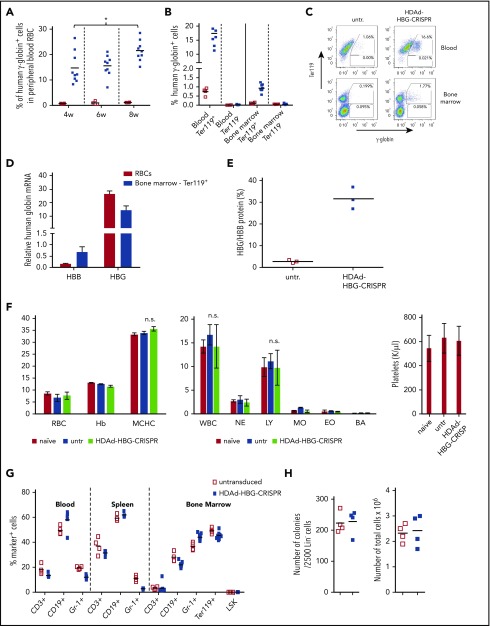
Figure 3.
Analysis of human γ-globin reactivation and hematological parameters after ex vivo transduction of β-YAC/CD46 Lin−cells with HDAd-HBG-CRISPR and subsequent transplantation. (A) Percentage of human γ-globin+ cells in peripheral blood RBCs measured by flow cytometry in blood samples taken at weeks 4, 6, and 8 after transplantation with untransduced Lin− cells (□) and HDAd-HBG-CRISPR–transduced Lin− cells (▪). *P < .05. (B-E) Analysis of samples collected at week 10 posttransplantation. (B) Percentage of human γ-globin+ cells in erythroid (Ter119+) and nonerythroid (Ter119−) cells in blood and bone marrow. (C) Representative flow cytometry samples for data shown in (B). (D) Relative human β-globin (HBB) and γ-globin (HBG) mRNA levels in mice transplanted with HDAd-HBG-CRISPR–transduced Lin− cells compared with mRNA levels in untransduced settings (taken as 1.0). (E) HPLC data. Percentage of human γ-globin protein relative to human β-globin protein. (F-H) Safety of ex vivo HDAd-HBG-CRISPR genome editing in mouse HSPCs. (F) Hematological parameters at week 10 include RBCs (M/μL), hemoglobin (hB; g/dL), mean corpuscular hemoglobin concentration (MCHC; g/dL), white blood cells (WBC; K/μL); neutrophils (NE; K/μL); lymphocytes (LY; K/μl); monocytes (MO; K/μl); eosinophils (EO; K/μL), and basophils (BA; K/μL), and platelets (K/μL). n = 3. (G) Cell composition in blood, spleen, and bone marrow at week 10 after transplantation. Shown is the percentage of lineage marker-positive cells (CD3+, CD19+, Gr-1+, Ter119+ cells) and HSPCs (LSK cells). (H) Colony-forming potential of bone marrow Lin− cells harvested at week 10 posttransplantation. Number of colonies that formed after plating of 2500 Lin− cells (left panel) and total number of cells pooled from colonies (right panel). Each point represents an individual animal. n.s., not significant.

