Figure 7.
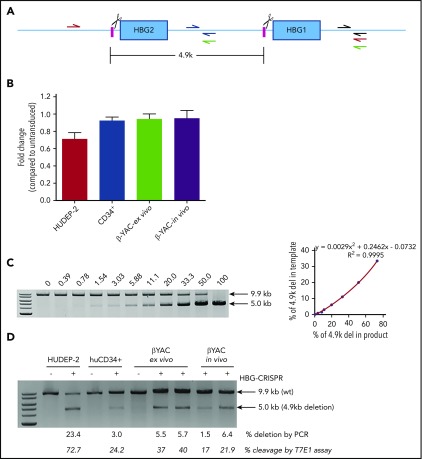
Analysis of a 4.9-kb deletion containing the HBG2 gene and the HBG2/HBG1 intergenic region. (A) Diagram showing the HBG1/2 region. The HBG CRISPR/Cas9 cleavage sites are indicated by scissors. Quantitative PCR (qPCR) primers targeting the intergenic sequence between the cleavage sites are indicated (blue half arrows). Another pair of primers binding outside of the deletion region (gray half arrows) was used as an internal control to adjust for differences in template DNA quality. Primers for semiquantitative PCR include the red primers (a 9.9-kb product would indicate no 4.9 kb deletion; a 5.0-kb product would indicate a 4.9-kb deletion), and green primers (a 3.9-kb product would indicate an inversion of the 4.9-kb region). (B) Comparative qPCR to detect the 4.9-kb deletion (blue and gray primers) in (A). HUDEP-2, human CD34+ cells, or βYAC/CD46 Lin− cells (β-YAC-ex vivo) were transduced with HDAd-HBG-CRISPR at a multiplicity of infection of 500, 1000, or 500 vp’s per cell, respectively. For CD34+ cells, a second transduction with HDAd–anti-CRISPR (multiplicity of infection = 1000) was conducted 2 days later. Genomic DNA was isolated at day 4 posttransduction. Furthermore, Lin− cells harvested at week 12 from in vivo HSPC-transduced β-YAC/CD46 mice were analyzed (β-YAC-in vivo). Untransduced samples were used for comparison of qPCR signals. Comparative qPCR was performed in sextuplicates. The signals from the intergenic HBG1/2 region (blue primers) were normalized to corresponding signals from the outside control region (gray primers) in (A). Data were calculated by the 2-ΔΔCt approach (a relative quantification strategy for qPCR data) and are shown as fold change compared with corresponding untransduced cells (taken as 1.0). (C-D) Semiquantitative PCR to detect the 4.9-kb deletion (red primers) or inversion (green primers) in (A). (C) Standard curve for detection of the 4.9-kb deletion. Genomic DNA isolated from untreated wild-type HUDEP-2 cells and a HDAd-HBG-CRISPR–transduced HUDEP-2 clone with a biallelic 4.9-kb deletion (supplemental Materials and methods) were mixed at various ratios and used as a template for PCR. The percentage of the PCR signal corresponding to the deletion is shown above the gel (left panel). Signals were quantified by ImageQuant and used to build a standard curve (right panel). (D) Percentage of the PCR signal corresponding to the 4.9-kb deletion in samples in (B). Two mice for the ex vivo and in vivo HDAd-HBG-CRISPR–transduction settings were used. The lower row of numbers shows the cleavage frequency measured by T7E1 assay in the given samples. Another PCR using the green primers did not show signals, indicating the absence of an inversion of the 4.9-kb region. The primers were validated using a synthesized gBlock as a positive control.

