. 2016 Jun 3;7(9):6208–6216. doi: 10.1039/c6sc00889e

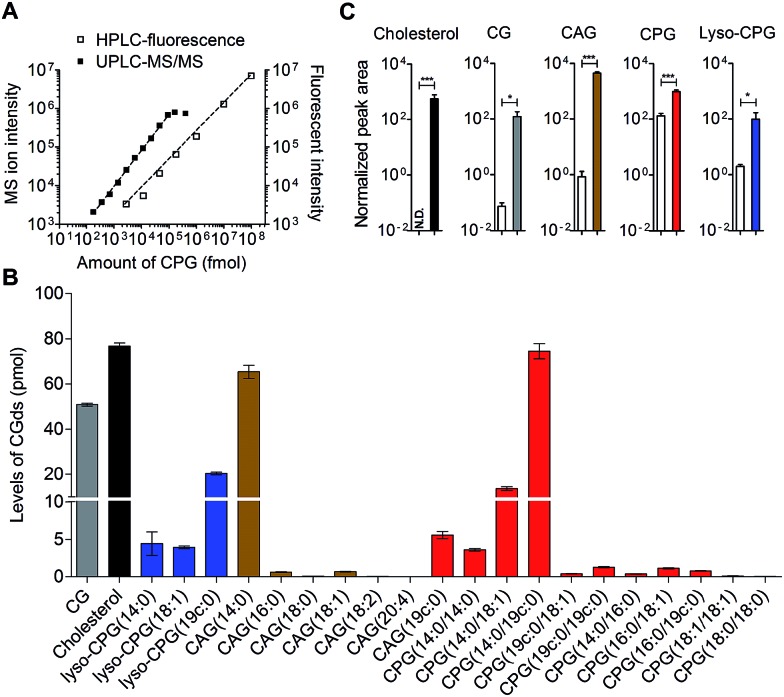
Fig. 3. Quantitative analysis of the labelled CGds. (A) Calibration curves of CPG(14 : 0/19c : 0) based on HPLC-fluorescence (λex = 428, λem = 528 nm) and UPLC-MS/MS operated in the product ion scan mode with a specific fragment selected for extracted ion chromatography quantification. The dynamic ranges of UPLC-MS/MS and HPLC-fluorescence were 0.088–100 pmol and 2.8 pmol–100 nmol per 106 bacteria, respectively. (B) Levels of various CGds per 106 bacteria as analysed by UPLC-MS/MS. (C) Enhanced ionization efficiency of fluorophore-labelled CGds in the mass spectrometry. H. pylori cells were pretreated with cholesterol (white bar) or compound 1 (grey bar) for two days. After harvest, the cholesterol-fed cells were extracted and directly analysed by UPLC-MS, whereas the 1-pretreated cells were extracted, labelled with MAN by click reaction and then analysed by UPLC-MS. The normalised peak area was determined by the peak area of CGds divided by the peak area of the internal standard (phosphoinositol). N.D., not detected, denotes a ratio of signal to noise of below three. Data shown were from three biological replicates. Error bars represent the standard deviations. All the statistically significant differences are indicated with asterisks; *P < 0.05, **P < 0.01, or ***P < 0.001 based on student's t test.

Fig. 3