. 2016 Jun 3;7(9):6208–6216. doi: 10.1039/c6sc00889e

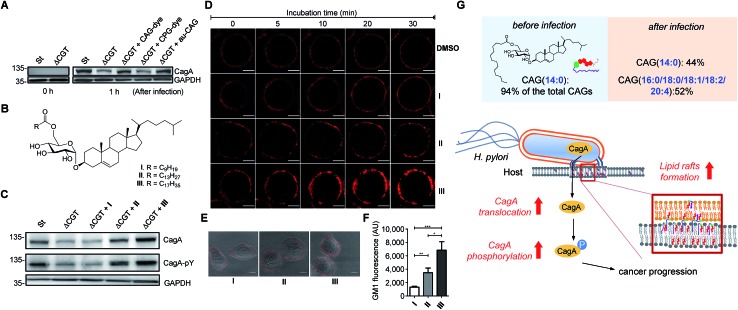
Fig. 6. Extent of CagA translocation and lipid raft formation under various conditions. (A) CagA translocation in AGS cells cultured with H. pylori 26695 (St), a cholesterol glucosyltransferase-deficient strain (ΔCGT), or ΔCGT pretreated for 30 min with fluorescently-labelled CAG(14 : 0) (CAG-dye), fluorescently-labelled CPG(14 : 0/19c : 0) (CPG-dye) or authentic CAG(14 : 0) (au-CAG). Translocated CagA was detected by immunoblotting before and 1 h after infection. (B) Structures of CAGs containing an O6′ ester of decanoic acid (I), myristic acid (II) and stearic acid (III). I carries the shortest fatty acid chain; while II and III carry the most abundant fatty acid chains in H. pylori and humans, respectively. (C) Effects of CAGs with different acyl chains on CagA translocation and CagA tyrosine phosphorylation as detected by immunoblotting after the co-culture of AGS cells with H. pylori strains for 4 h as described in (A). (D) Time-lapse images of AGS cells treated with CAGs (I, II or III). Lipid rafts (GM1) in AGS cells were first labelled with Alexa Fluor 594-conjugated cholera toxin subunit β, followed by treatment with the indicated CAGs (10 : 0, 14 : 0 or 18 : 0) at 37 °C. Time-lapse images were collected under a Zeiss LSM 510 confocal microscope at 0, 5, 10, 20 and 30 min. Scale bars, 5 μm. (E) Representative confocal immunofluorescence images for AGS cells that were first treated with CAGs (I, II or III) for 30 min prior to the labelling of GM1. Scale bars, 10 μm. (F) Quantitation of the fluorescent intensities measured in (E). At least 40 GM1-positive AGS cells from each treatment were scored for the quantitative analysis using ImageJ software. Statistical significance was evaluated using Student's t-test (*P < 0.05, **P < 0.01 or ***P < 0.001). (G) The figure demonstrates how the uptake of human lipids enhances bacterial virulence. The resulting uptake altered the bacterial CAG compositions (especially CAGs containing longer or/and unsaturated fatty acid chains), leading to a higher level of CagA translocation and lipid raft formation.

Fig. 6