Figure 8.
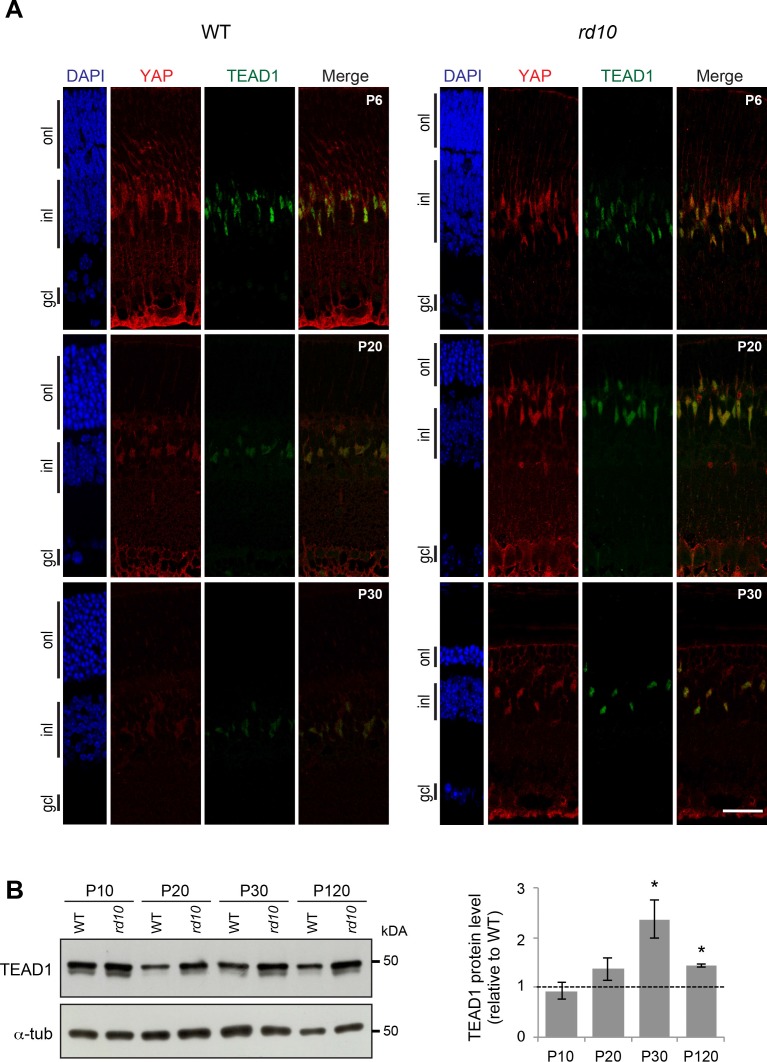
TEAD1 expression during retinal degeneration. (A) Coimmunostaining with anti-YAP (red) and anti-TEAD1 (green) antibodies on retinal section of WT and rd10 mice at P20. Nuclei are DAPI counterstained (blue). (B) Representative western blots of retinal protein extracts from WT and rd10 mice at different stages from P10 to P120, probed with anti-TEAD1 antibody or anti-α-tubulin as a loading control. Histogram representation corresponds to the quantification of TEAD1 western blot signals normalized to α-tubulin (α-tub) and relative to WT at each stage (dashed line). Mean values ± SEM from two independent western blot experiments are shown. Asterisk indicates P value ≤ 0.05 (Mann-Whitney U test). onl, outer nuclear layer; gcl, ganglion cell layer. Scale bar: 20 μm.

