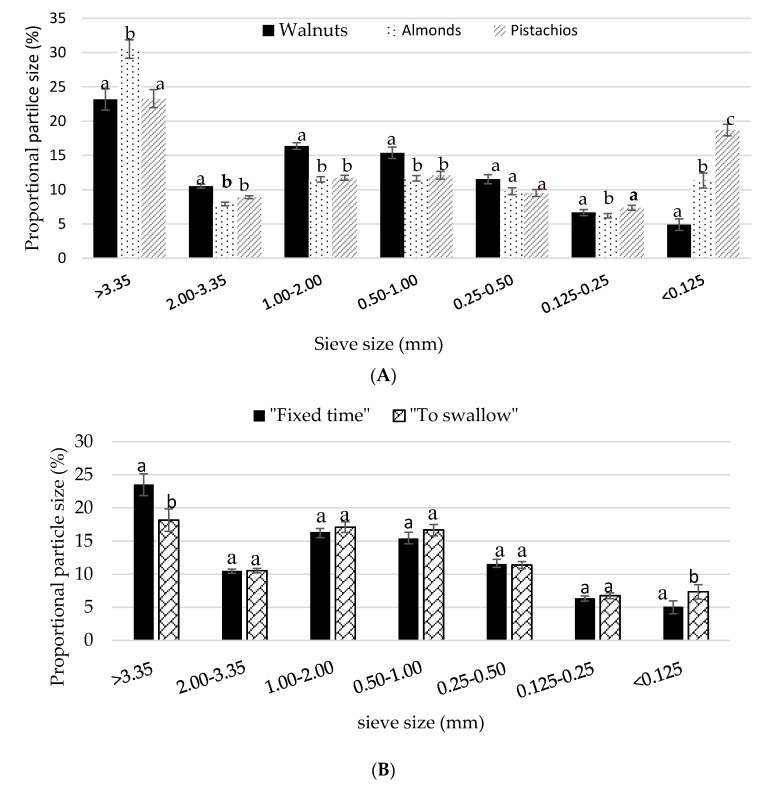
Figure 3.
(A) Mean ± S.E.M particle size distribution of nuts chewed in isolation. Comparisons are based on two-way repeated measures ANOVA with post hoc Bonferroni multiple comparison test. Different lower case letters denote significant differences between nuts (p < 0.05); (B) Mean ± S.E.M particle size distribution by size of walnuts chewed for a fixed time and to the point of swallowing. Letters that are different denote significant differences between mastication protocols (p < 0.05).

