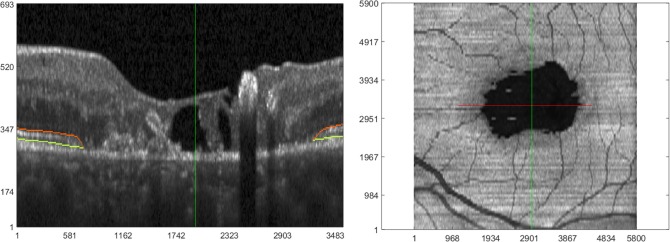
Figure 1.
OCT imaging of a subject with type 2 MacTel. (Left) Representative zoomed-in section of a B-scan, where the orange and light green lines correspond to the boundaries of the EZ band. For clarity of visualizing pathology, this B-scan is laterally and axially clipped in the central portion. (Right) En face OCT created by averaging pixel intensities in the EZ band of 97 equally distanced B-scans. The horizontal red line in the en face image corresponds to the location and extent of the zoomed-in B-scan on the left. Note that each B-scan (before clipping) laterally spans 5800 μm, which corresponds to the horizontal length of the en face image. The vertical dark green lines (in both images) show corresponding positions on en face and B-scan images. A “collapse” or break in EZ band on the B-scan image corresponds to the prominent dark area on en face OCT. Units for x- and y-axes in both images are microns.

