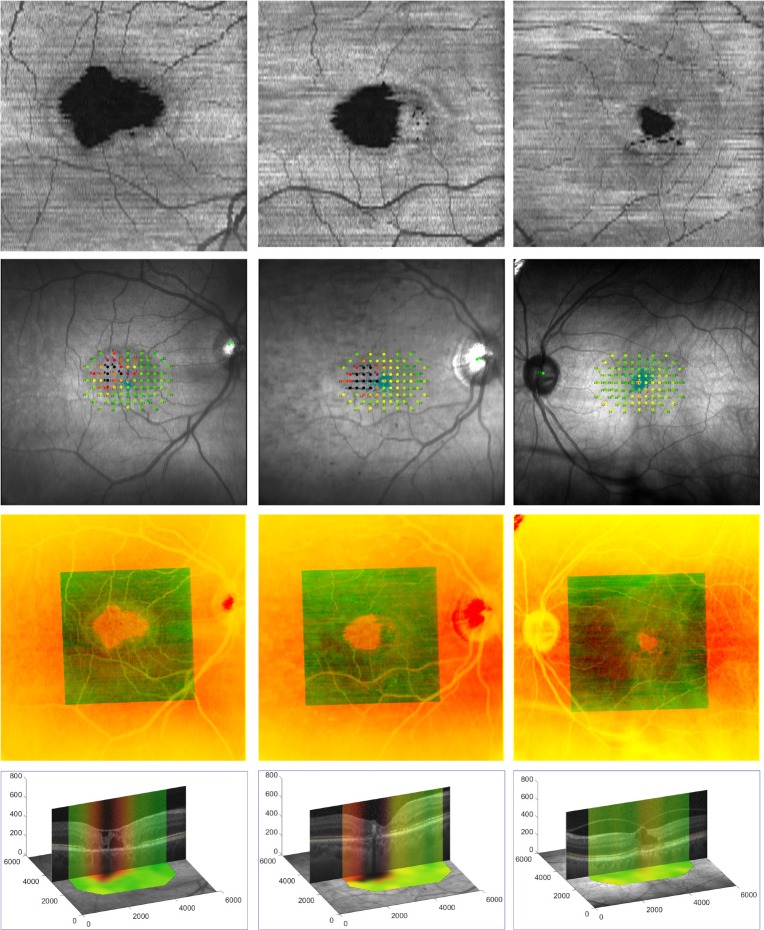
Figure 2.
Registration of en face OCT SVP and microperimetry images. Each column represents a different eye. Rows from top to bottom display (first row) OCT SVP, (second row) MAIA SLO fundus image with microperimetry map, (third row) registered overlay, and (fourth row) B-scan crossing through the center of the EZ break anchored on the OCT SVP. The overlay image in the third row shows the smaller field-of-view OCT SVP (in green) registered on the microperimetry images (in red). The overlap of vessels in the overlay image qualitatively attests to the accuracy of our registration. In the fourth row, pseudo-color stripes on the central B-scan represent the corresponding sensitivity profile as obtained from the registered interpolated microperimetry maps, visualizing the morphology/sensitivity correlations. x-, y-, and z-axis units in the fourth row are microns.

