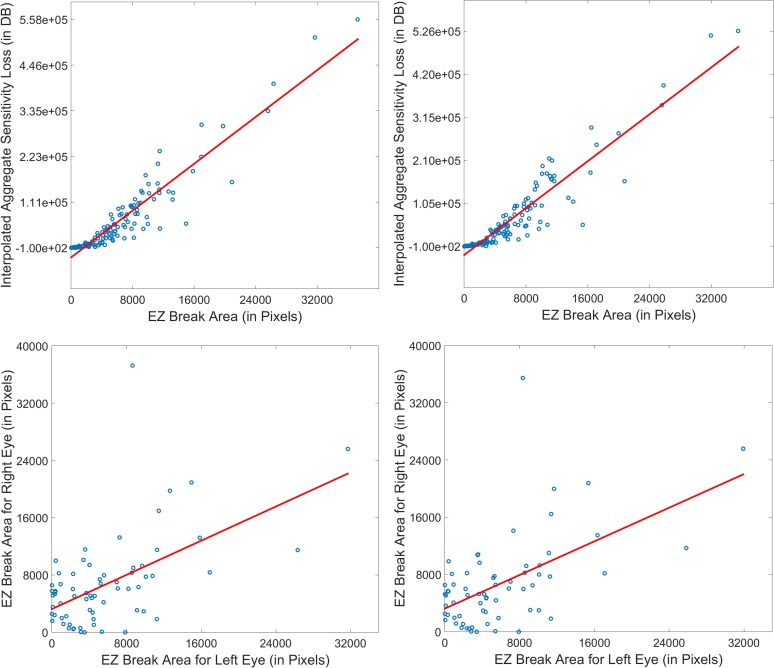
Figure 4.
Correlation between EZ break and microperimetry sensitivity data. (Left column) Data from first visit; (right column) data from second visit. Top row represents correlation between interpolated aggregate sensitivity loss and EZ break area (0.94 for both first and second visit). Bottom row represents correlation between EZ break areas of the left and right eyes (0.56 for both first and second visits).

