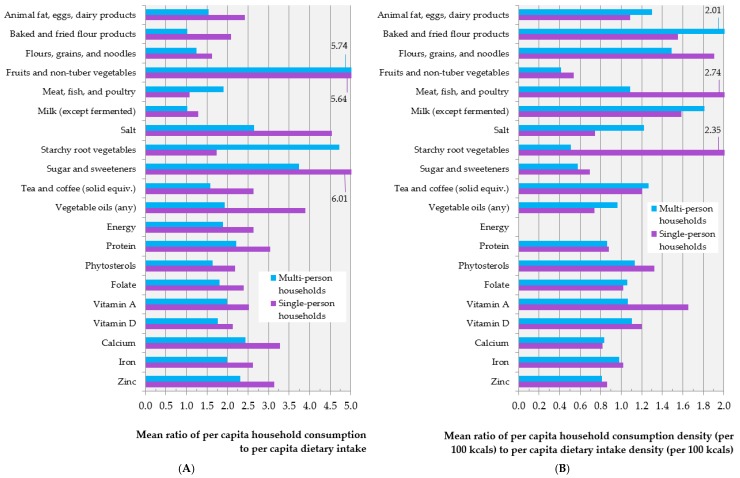
Figure 2.
Mean ratio of per-capita household consumption to per-capita dietary intake (A), and per-capita household consumption density (per 100 kcal) to per-capita dietary intake density (per 100 kcal); (B) for food groups and selected nutrients among 109 FCS-HH households fully-enumerated by the nested FCS-24 (Aim 1). Values for 6 data points exceed the graphs’ x-axis limits and are indicated using annotations. Abbreviations: FCS-HH (2013 Food Consumption Survey), FCS-24 (nested 24-h recall).

