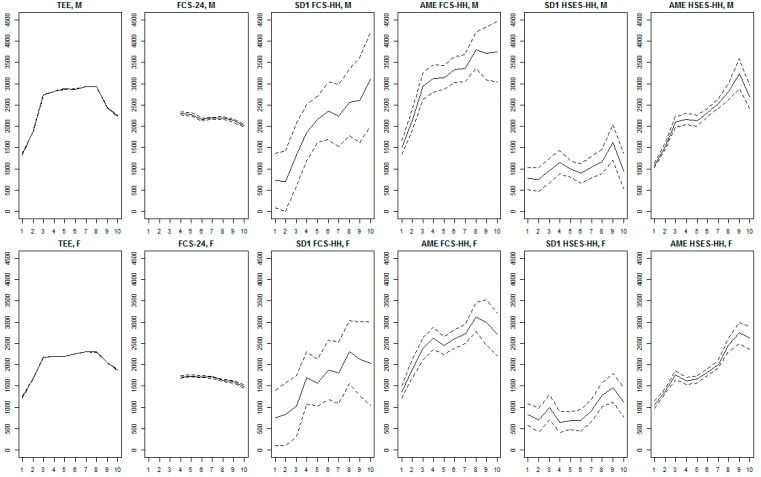
Figure 3.
Comparison between mean daily estimated energy expenditure, observed dietary energy intake, and disaggregated household consumption estimates of individuals’ energy intake (kcal/day) across 10 age groups of males and females (Aims 2 and 3). y-axis: daily energy intake (kcal/day); x-axis: age groups 1–10 (1: 0 to 4 years, 2: 5–9, 3: 10–14, 4: 15–19, 5: 20–29, 6: 30–39, 7: 40–49, 8: 50–59, 9: 60–69, 10: 70+); row 1: males (“M”); row 2: females (“F”); column 1: mean predicted total energy expenditure (“TEE”); column 2: mean observed dietary energy intake from the FCS 24-h recall (“FCS-24”); column 3: unadjusted statistical disaggregation of FCS-HH (“SD1 FCS-HH”); column 4: adult male equivalent method (AME)-like statistical disaggregation of FCS-HH (“SD2 FCS-HH”); column 5: AME disaggregation of FCS-HH (“AME FCS-HH”); column 6: unadjusted statistical disaggregation of HSES-HH (“SD1 HSES-HH”); column 7: AME-like statistical disaggregation of HSES-HH (“SD2 HSES-HH”); column 8: AME disaggregation of HSES-HH (“AME HSES-HH”). Solid lines indicate means of age- and sex-specific measurements (FCS-24) or predictions (TEE and disaggregated household estimates), while dashed lines indicate associated 95% confidence limits. Statistics are survey-weighted. Abbreviations: FCS-HH (2013 Food Consumption Survey), HSES-HH (2012/2014 Household Socio-Economic Survey), AME (adult male equivalent method).

