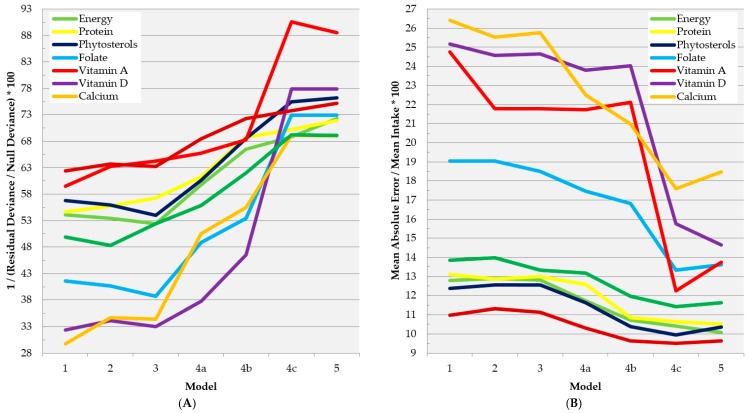
Figure 4.
In-sample fit statistics for increasingly complex predictive models of individuals’ dietary intakes of selected nutrients in the FCS-24 (Aim 4). (A) percentage of deviance explained; (B) mean absolute bias (proportional to mean observed dietary intake). See Table 4 for detailed descriptions of models 1–5. Brief description of variable categories considered for selection in each model: (1) Household and individual demographic, socioeconomic, and lifestyle characteristics; (2) Model 1 variables + quantitative total household consumption of food groups and nutrients; (3) Model 2 variables + individuals’ self-evaluation of nutrition knowledge and its application to their lives; (4a) Model 3 variables + cursory qualitative 24-h recall and assessment of eating behaviors; (4b) Model 3 variables + cursory semiquantitative 24-h recall and assessment of eating behaviors; (4c) Model 3 variables + detailed semiquantitative 24-h recall; (5) Model 4 variables + measured anthropometry. Abbreviation: FCS-24 (nested 24-h recall of the 2013 Food Consumption Survey).

