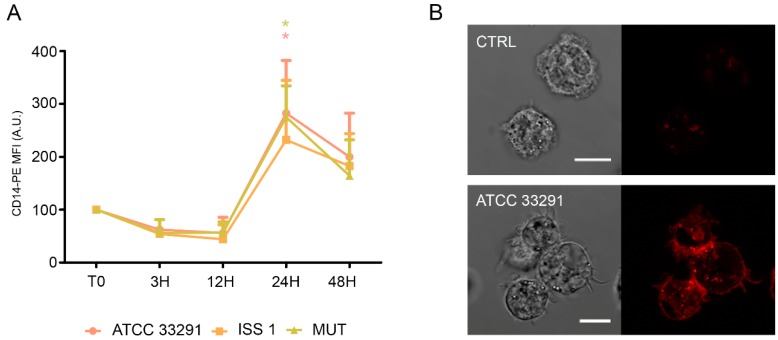
Figure 6.
CD14 expression. (A) Graph showing CD14 expression in monocytes preincubated with the lysates. The mean values were converted to A.U., setting the control (T0) to 100. Each value is expressed as the mean ± SD (results from n ≥ 3 independent experiments). Two-way ANOVA with Bonferroni’s multiple comparison test revealed: * p < 0.05 vs. control (T0). The trend during the time course was determined to be significant; (B) Confocal images of CD14-PE with the relative BF images from monocyte control cells and monocytes preincubated with the C. jejuni ATCC 33291 lysate for 24 h. Bars: 10 µm.

