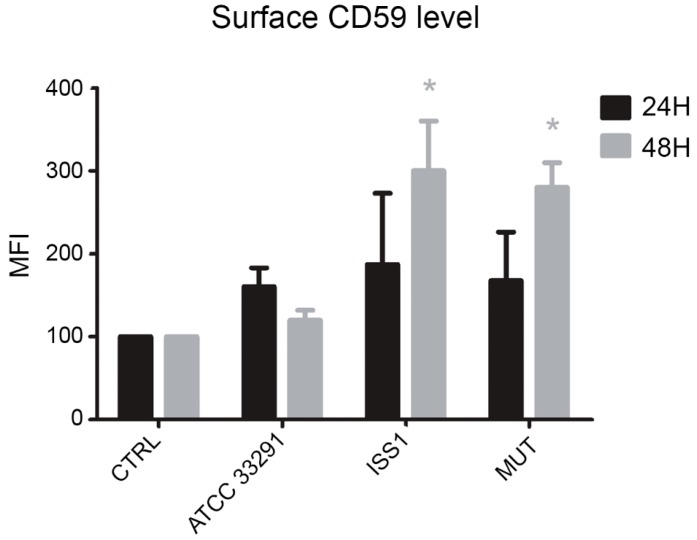
Figure 10.
Bar graph of CD59 expression for each experimental condition after 24 and 48 h of treatment. The mean values were converted to A.U., setting the control (T0) to 100. Each value is expressed as the mean ± SD (results from n ≥ 3 independent experiments) Two-way ANOVA with Bonferroni’s multiple comparison test revealed: * p < 0.05 vs. control (T0).

