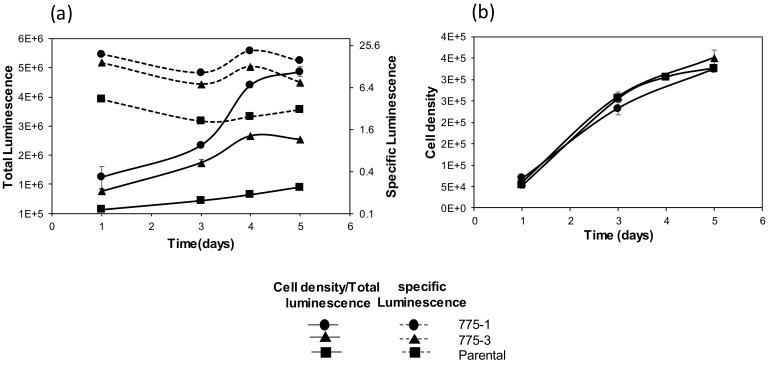
Figure 3.
Time course growth and luciferase activity from parental and OAZ1 deleted cells. Cells were seeded in duplicates, in 12-well plates at 1 × 10⁵ cells per well. (a) Total and specific luciferase activity quantified for a five-day period; and (b) cell density determined by luminescence based assay for the same five-day period. Graphs represent one of three independent studies and error bars represent standard deviation of duplicate measurements.

