Figure 4.
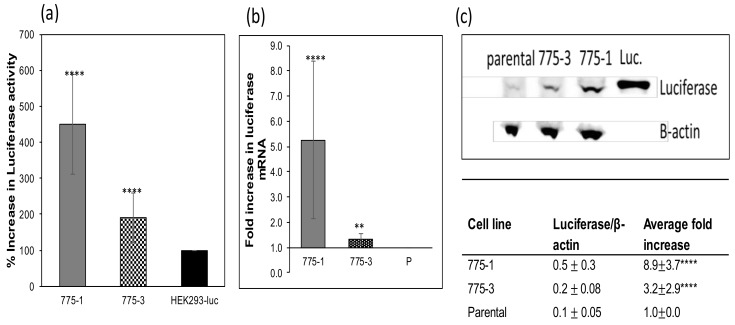
Luciferase activity, transcription, and expression. (a) Luciferase was quantified and reported as described above. The results represent the average of at least five independent assays, each carried out in duplicates, and error bars represent the standard deviation (****, p-value < 0.0001). (b) RT-qPCR of reverse-transcribed total cellular mRNA using primers targeting luciferase cDNA confirms higher transcriptional levels of luciferase mRNA in the OAZ1- cell lines of approximately 500% for 775–1 (****, p-value < 0.0001) and approximately 150% for 775–3 (**, p-value < 0.05), compared to the parental cell line. The assay was carried out in triplicates, and the results represent the average of three independent assays, with error bars representing the standard deviation. (c) Western blot analysis of 340 µg of whole cell lysates and 100 ng of recombinant luciferase protein for luciferase and β-actin expression, using anti-luciferase and anti-β-actin primary antibodies showing higher levels of intracellular luciferase protein in the knockout cell lines, 775–1 and 775–3, than in the parental cell line. ImageJ program was used to quantify the band intensities. β-actin-normalized luciferase band intensities were used to determine the fold increase in luciferase expression in the OAZ1- cell lines, 775–1 (8.9-fold; ****, p-value < 0.00001) and 775–3 (3.2-fold; ****, p-value < 0.00001), over the parental cell line. The results represent the average and standard deviation of three independent experiments, with a representative blot shown.

