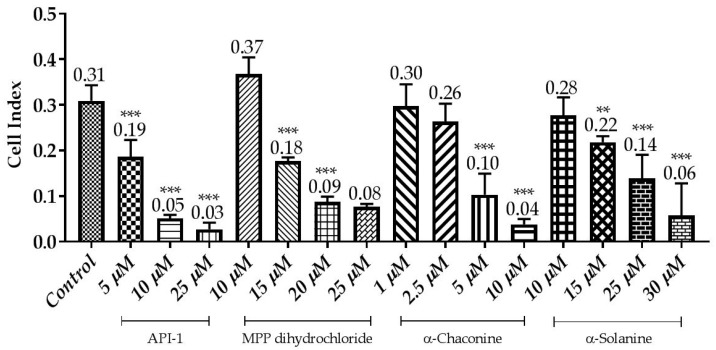
Figure 11.
Correlation between cell index and the compounds effects using the xCELLigence system. Cells were treated with various concentrations of the compounds for 24 h. The CI was calculated from four repeated data and presented as mean ± SD. ** p < 0.01 and *** p < 0.001 compared with the untreated control.

