
FIGURE 1.
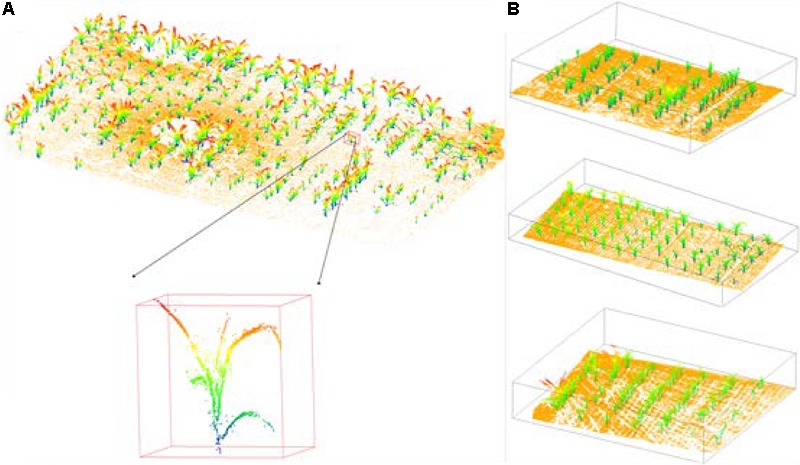
The maize data scanned by terrestrial Lidar of training site and testing sites, whose ground points are in yellow. (A) The training site: each maize was manually segmented from the group and colorized by height. (B) The testing sites with sparse (top), moderate (middle), and dense (bottom) planting density.