
FIGURE 5.
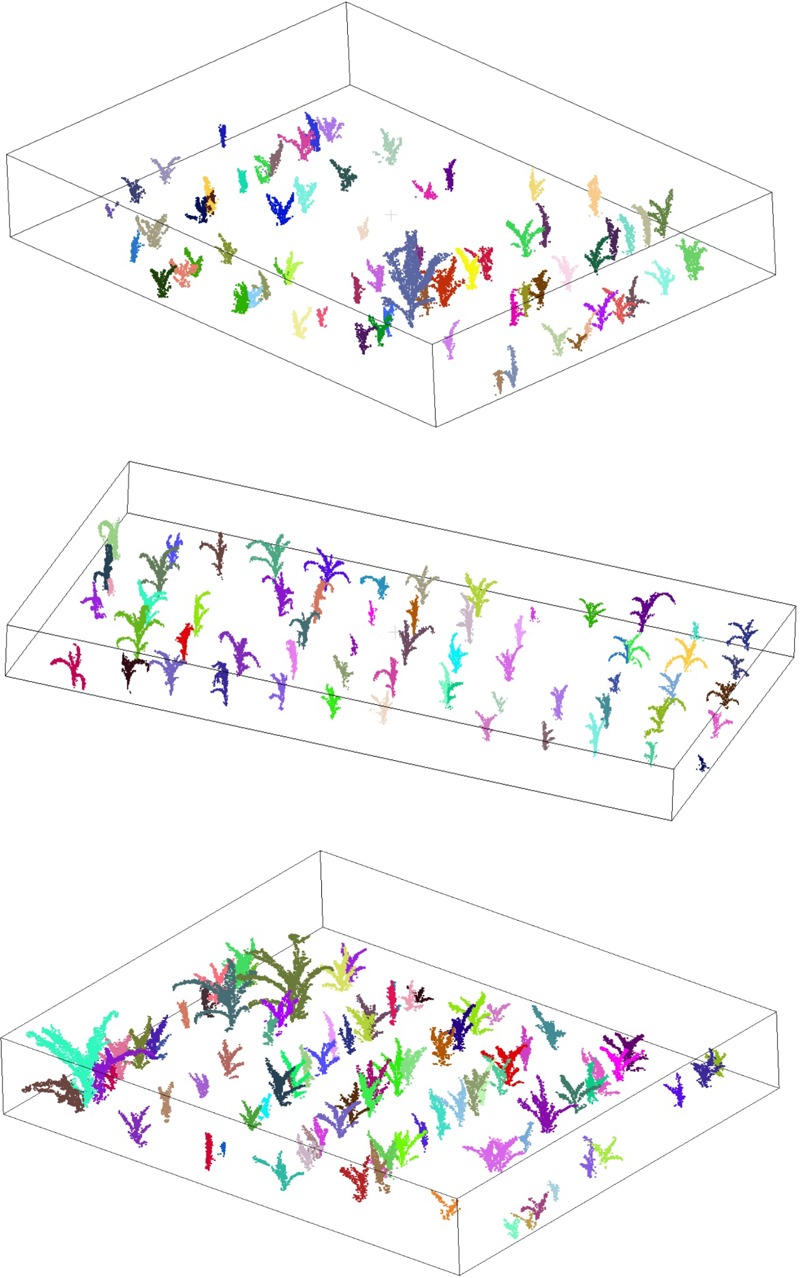
The segmentation results of sparse (top), moderate (middle), and dense (bottom) testing sites. The segmented individual maize are represented by unique colors.
Official websites use .gov
A
.gov website belongs to an official
government organization in the United States.
Secure .gov websites use HTTPS
A lock (
) or https:// means you've safely
connected to the .gov website. Share sensitive
information only on official, secure websites.
The segmentation results of sparse (top), moderate (middle), and dense (bottom) testing sites. The segmented individual maize are represented by unique colors.