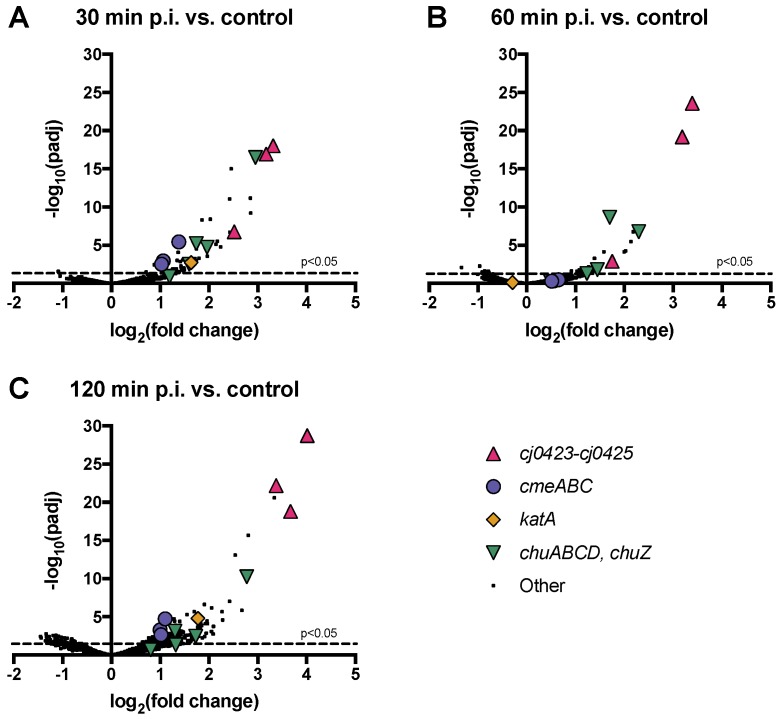
Figure 2.
Many C. jejuni NCTC 11168 genes are upregulated in response to NCTC 12673 phage infection, while relatively few are downregulated. Volcano plots show all transcribed C. jejuni NCTC 11168 genes at (A) 30, (B) 60, and (C) 120 min post infection by NCTC 12673 phage compared to mock-infected controls at each time point. The negative log of the false discovery rate-adjusted P-value vs. the log2 fold change between the conditions indicated is plotted for each gene. Selected highly significantly differentially expressed genes are represented by different colours and symbols according to their predicted or known function.

