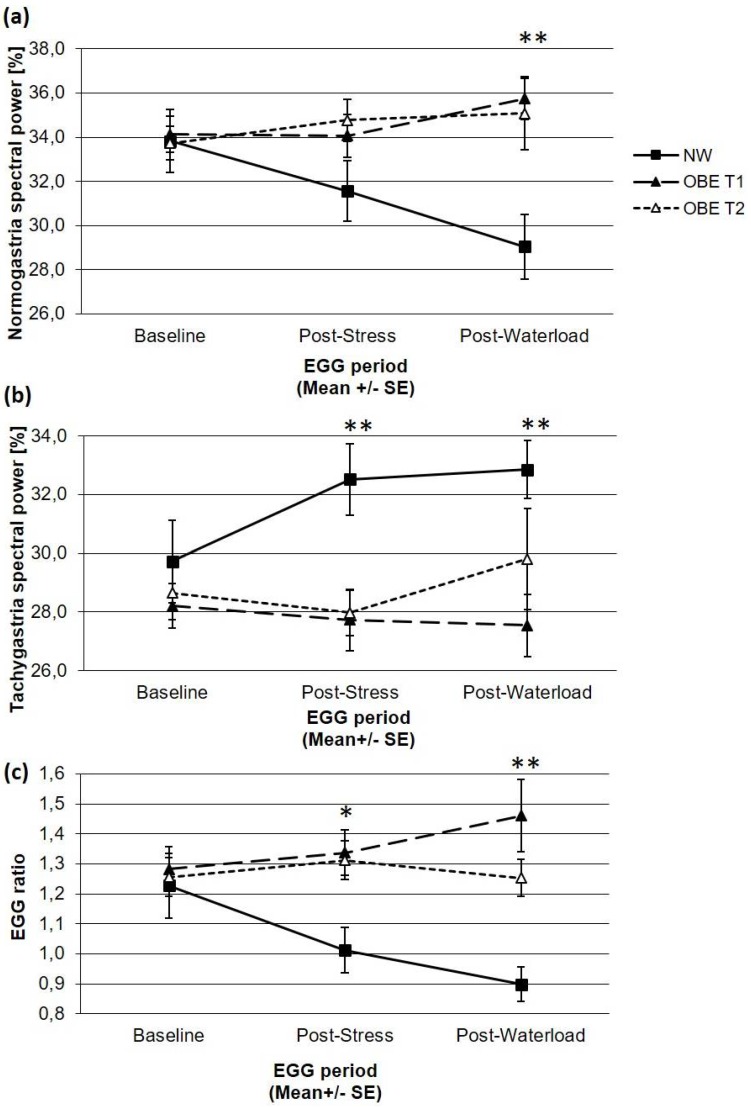
Figure 1.
EGG parameters of gastric myoelectrical activity in children with obesity (OBE) before (T1) and after (T2) weight loss and normal-weight control children (NW), depicted as (a) normogastria spectral power (%), (b) tachygastria spectral power (%), and (c) the ratio between normogastria and tachygastria (comparisons between OBE T1 and NW: * FDR < 0.05, ** FDR < 0.01).

