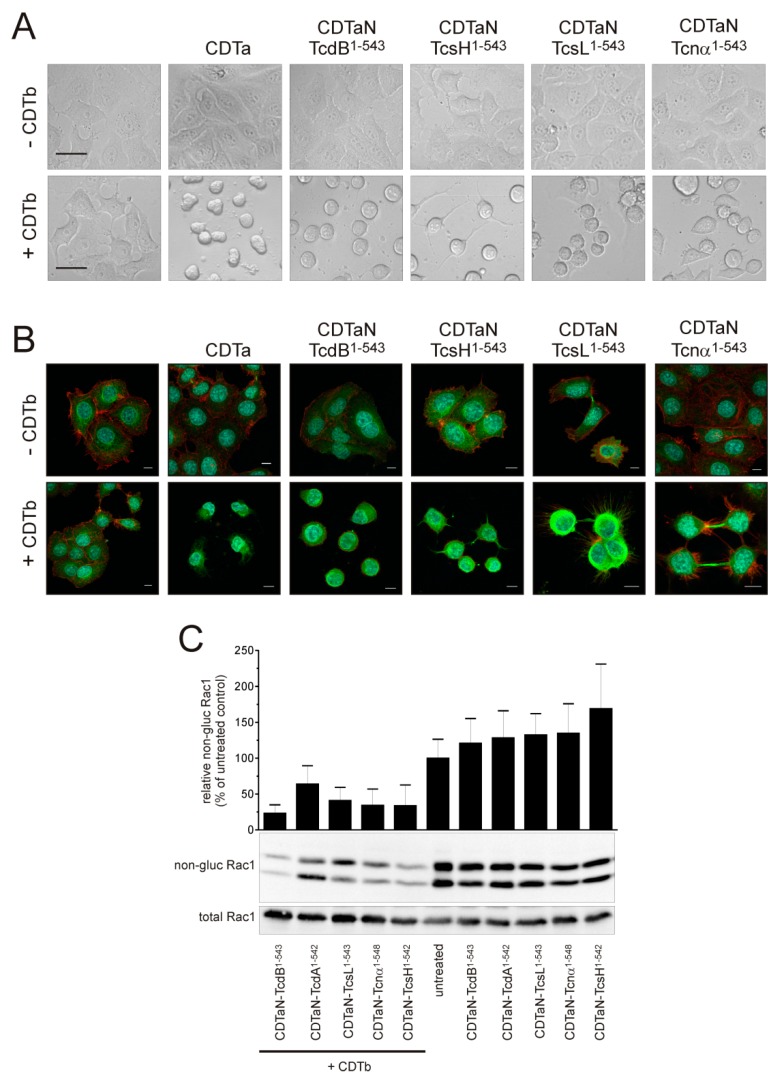
Figure 3.
Exploiting the CDT system for standardized delivery of various clostridial GTDs. (A) Phase-contrast microscopy of cell rounding assays showing intracellular delivery of CDTa and of all tested CDTaN fusion GTDs (CDTaN–TcdB1–543, CDTaN–TcsH1–542, CDTaN–TcsL1–543, CDTaN–TcnA1–548). Scale bars in untreated controls represent 20 µm; (B) Immunofluorescence staining of filamentous actin (red), tubulin (green), and the nucleus (blue) of cells treated with the indicated fusion toxins in the absence or presence of CDTb. The scale bars represent 10 µm; (C) Indirect proof of Rac1 glucosylation by immunoblot against non-glucosylated Rac1 verifies the intracellular modification of the common substrate GTPase by all fusion toxins.

