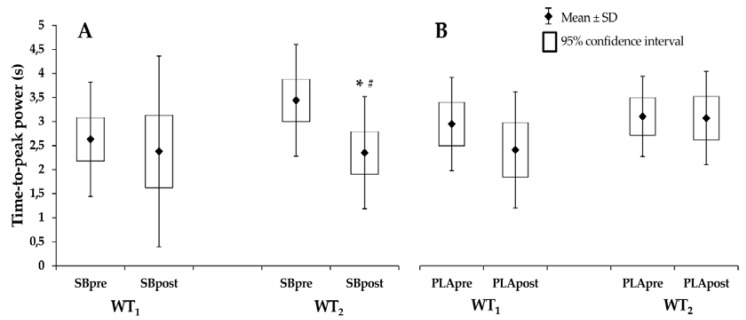
Figure 2.
Time-to-peak power in the anaerobic Wingate test. (A) Before and after sodium bicarbonate. (B) Before and after placebo. Values are means ± standard deviation (and 95% confidence intervals). Abbreviations: SBpre—before sodium bicarbonate supplementation, SBpost—after sodium bicarbonate supplementation, PLApre—before placebo treatment, PLApost—after placebo treatment, WT1—the Wingate test before the dummy throw test, WT2—the Wingate test after the dummy throw test. * significantly different from SBPRE in the WT2 (p = 0.0018), # significantly different from PLAPOST in the WT2 (p = 0.0142).

