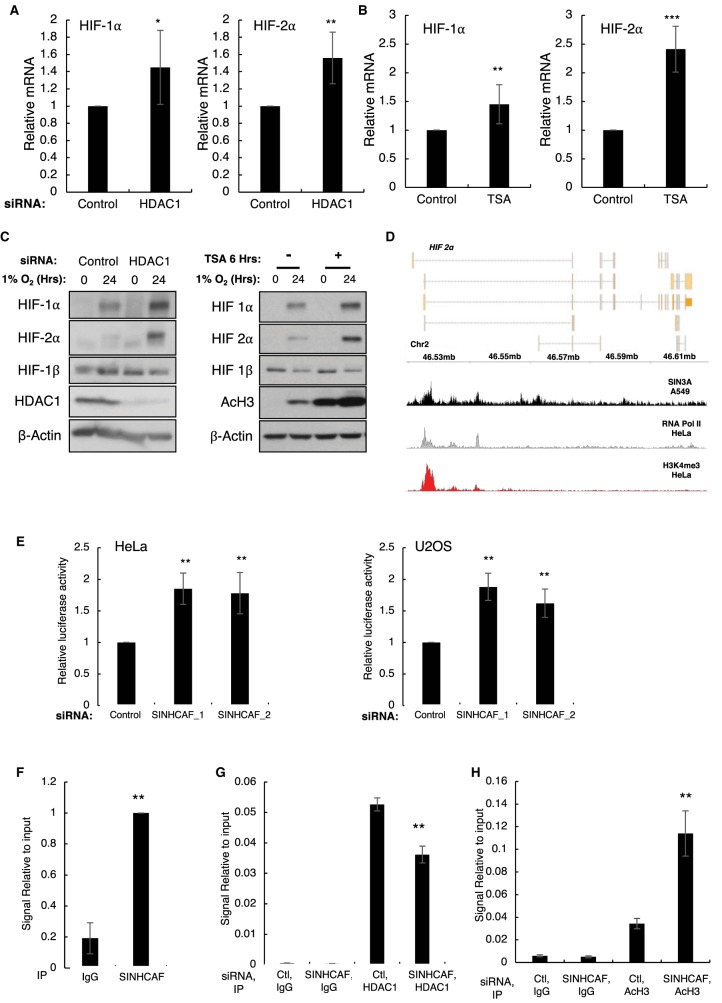
Figure 3. SINHCAF, but not HDAC1, is a specific repressor of HIF-2α promoter.
(A) HDAC1 or non-targeting siRNA oligonucleotides were transfected to HeLa cells prior to RNA extraction. RNA expression of the HIF-α isoforms was determined by qPCR. Graphs depict mean + SEM. *P ≤ 0.05, **P ≤ 0.01, ***P ≤ 0.001. (B) HeLa cells were treated with TSA for 6 h and RNA was extracted. qPCR analysis for the levels of HIF-1α and HIF-2α was performed. Graphs depict mean + SEM. *P ≤ 0.05, **P ≤ 0.01, ***P ≤ 0.001. (C) HDAC1 or non-targeting siRNA oligonucleotides were transfected to HeLa cells cultured in the presence or absence of hypoxia for 24 h (right panel). HeLa cells were treated with TSA for 6 h and exposed or not to 24 h of 1% O2, prior to lysis (left panel). Lysed samples were analyzed by immunoblot for expression of HIF system isoforms. (D) Coverage track analysis of SIN3A ChIP-sequencing in A549 cells at the HIF-2α gene. RNA Pol II and H3K4me3 coverage tracks for HeLa are also shown. (E) HeLa and U2OS cells stably expressing an HIF-2α promoter–renilla luciferase reporter construct were transfected with control or one of two SINHCAF [1/2] siRNA oligonucleotides and luciferase activity was measured. Graphs depict mean + SEM. *P ≤ 0.05, **P ≤ 0.01, ***P ≤ 0.001. (F) ChIP for SINHCAF was performed in HeLa cells and HIF-2α promoter occupancy was analyzed by qPCR. Graphs depict mean + SEM. *P ≤ 0.05, **P ≤ 0.01, ***P ≤ 0.001. (G) ChIP for HDAC1 was performed in HeLa cells that had been transfected with control or SINHCAF siRNA oligonucleotides. An assessment of HIF-2α promoter occupancy was performed by qPCR. Graphs depict mean + SEM. *P ≤ 0.05, **P ≤ 0.01, ***P ≤ 0.001. (H) Change in histone H3 acetylation at the HIF-2α promoter was analyzed following SINHCAF knockdown by qPCR. Graphs depict mean + SEM. *P ≤ 0.05, **P ≤ 0.01, ***P ≤ 0.001. See also Supplementary Figure S1.

