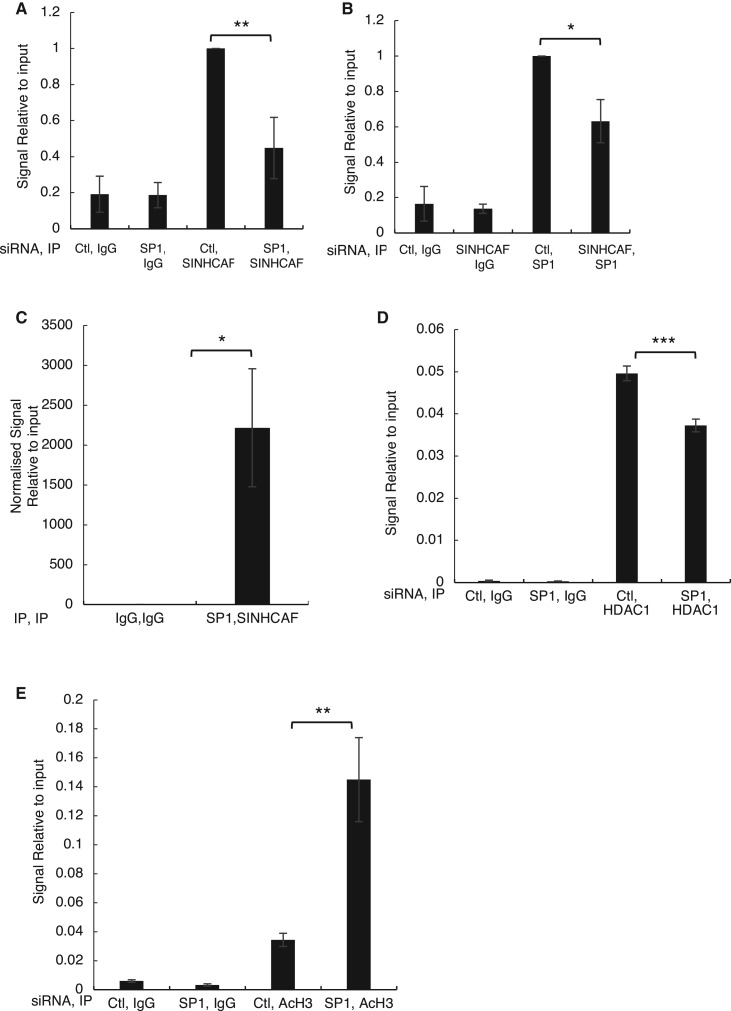
Figure 5. SP1 is required for SINHCAF occupancy at the HIF-2α promoter.
(A) ChIP for SINHCAF was performed in HeLa cells that had been transfected with control, or SP1 siRNA oligonucleotides. Signal relative to input for control samples was set to 1. Additional experimental conditions were compared with control, as shown. Graphs depict mean + SEM. *P ≤ 0.05, **P ≤ 0.01, ***P ≤ 0.001. (B) ChIP for SP1 was performed in HeLa cells that had been transfected with control, or SINHCAF siRNA oligonucleotides. Signal relative to input for control samples was set to 1. Additional experimental conditions were compared with control, as shown. Graphs depict mean + SEM. *P ≤ 0.05, **P ≤ 0.01, ***P ≤ 0.001. (C) Re-ChIP SP1/SINHCAF confirmed co-occupancy at the HIF-2α promoter. Graphs depict mean + SEM. *P ≤ 0.05, **P ≤ 0.01, ***P ≤ 0.001. (D) HDAC1 promoter occupancy in the presence or absence of SP1. Graphs depict mean + SEM. *P ≤ 0.05, **P ≤ 0.01, ***P ≤ 0.001. (E) Change in histone H3 acetylation at the HIF-2α promoter was quantified following SP1 knockdown. N = 3. Graphs depict mean + SEM. *P ≤ 0.05, **P ≤ 0.01, ***P ≤ 0.001.

