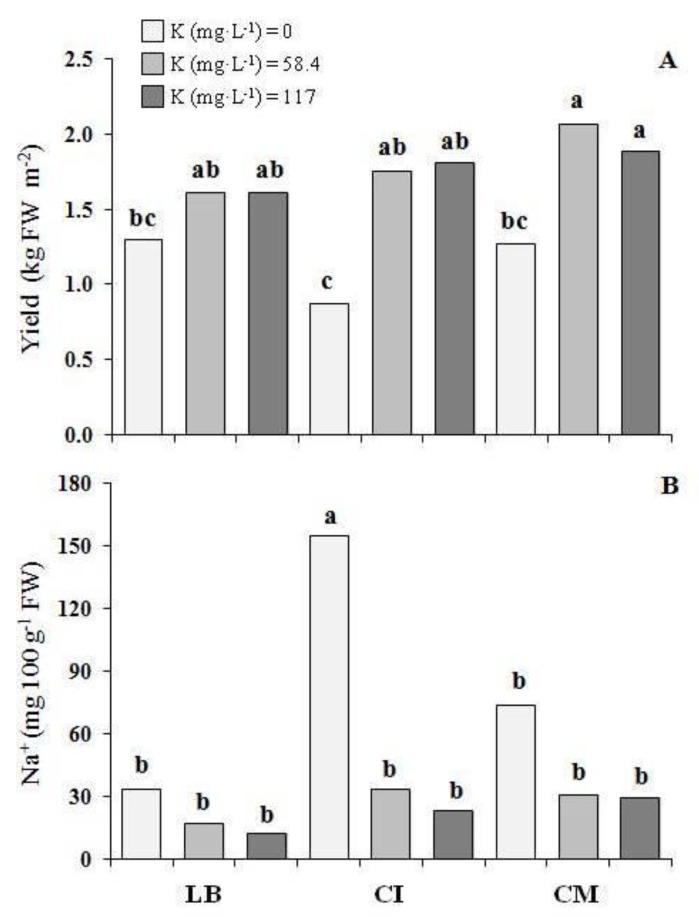
Figure 3.
(A) Yield and (B) Na+ content of three genotype of microgreens grown with three potassium levels (first experiment). LB—lettuce ‘Bionda da taglio’; CI—chicory ‘Italico a foglia rossa’; CM—chicory ‘Molfetta’. For each histogram, the same lowercase letters indicate that the mean values are not significantly different (p = 0.05).

