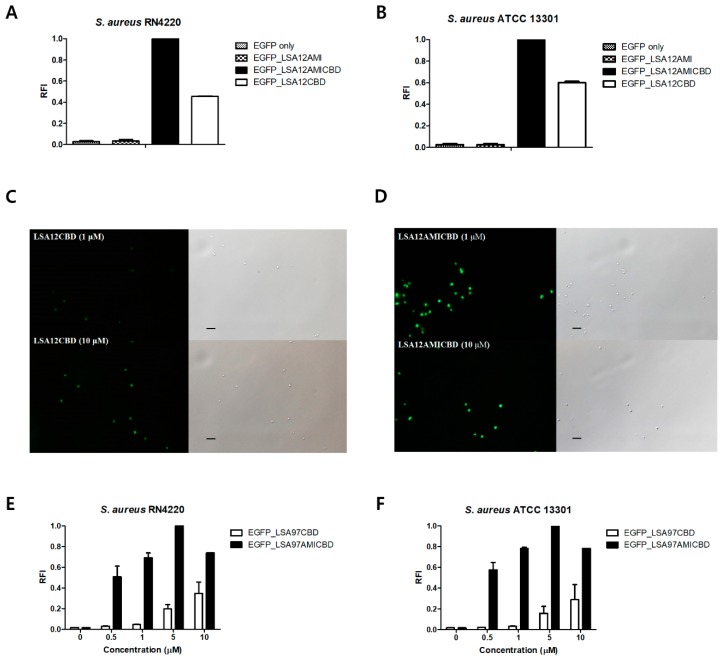
Figure 4.
Binding activity comparison among EGFP-fused LysSA12 derivatives. Relative cell binding activities of 1 μM of EGFP_LSA12AMI, EGFP_LSA12AMICBD, and EGFP_LSA12CBD toward (A) S. aureus RN4220 and (B) S. aureus ATCC 13301. Optical and florescent images of S. aureus RN4220 after the addition of (C) EGFP_LSA12CBD and (D) EGFP_LSA12AMICBD at 1 μM (top) and 10 μM (bottom). Relative cell binding activities of EGFP_LSA12CBD and EGFP_LSA12AMICBD were measured with (E) S. aureus RN4220 and (F) S. aureus ATCC 13301 at different concentrations. EGFP did not show binding to S. aureus. The data shown are the mean values from three independent measurements and the error bars represent the standard deviations. The scale bar represents 2 μm.

