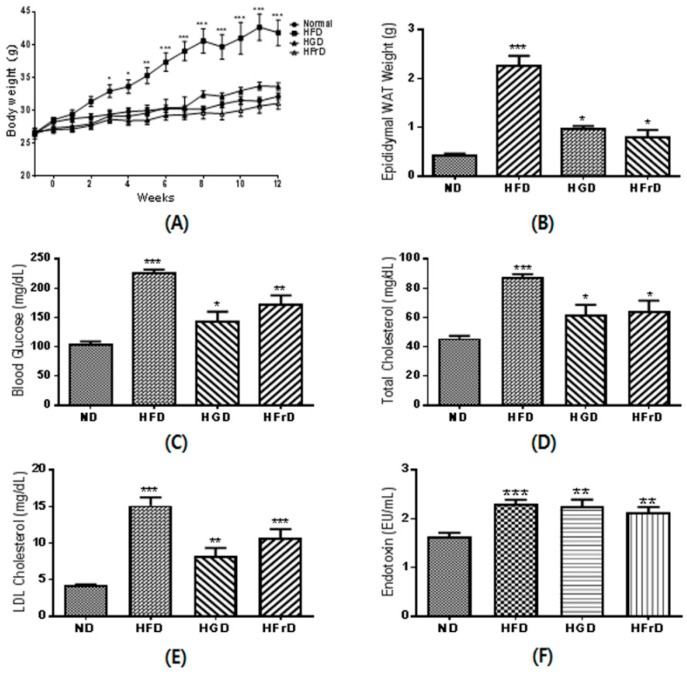
Figure 1.
Metabolic disorder parameters in high-glucose diet (HGD) or high-fructose diet (HFrD) fed mice. (A) body weight changes during the 12 weeks of feeding; (B) white adipose tissue (WAT) weight; (C) fasting blood glucose; (D) serum total cholesterol; (E) serum low-density lipoprotein (LDL)-cholesterol; (F) serum endotoxin. Data are presented as the mean ± SEM for 9 mice per group (* p < 0.05, ** p < 0.01, and *** p < 0.001 vs. ND).

