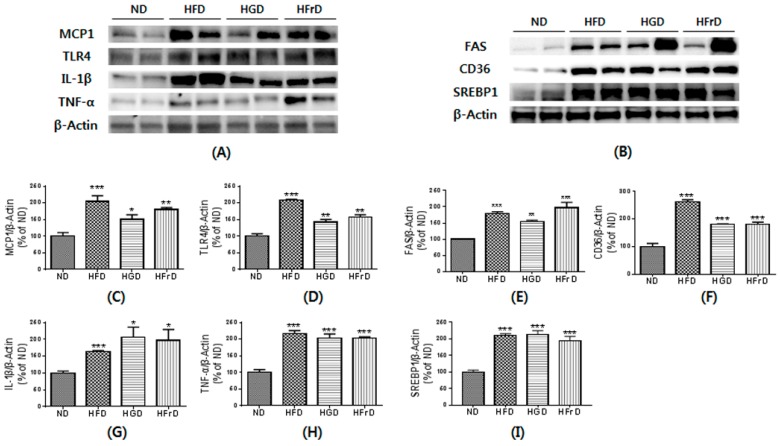
Figure 5.
HFD, HGD or HFrD-induced hepatic inflammation and change of lipid metabolism. (A,B) representative images of Western blots for inflammatory cytokines (MCP1, TLR4, IL-1β and TNF-α) and lipid metabolism (FAS, CD36 and SREBP1); (C–I) relative band intensities of MCP1 (C), TLR4 (D), IL-1β (E), TNF-α (F), FAS (G), CD36 (H) and SREBP1 (I) normalized to those of β-actin. Bar values are presented as mean percentage of ND ± SEM of three independent experiments (* p < 0.05, ** p < 0.01, and *** p < 0.001 vs. ND).

