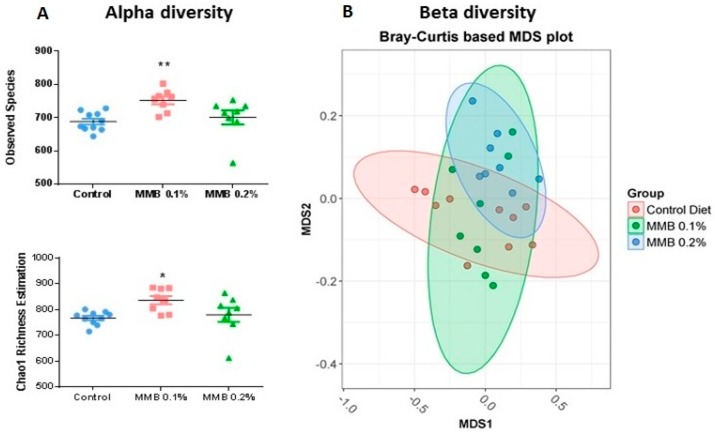
Figure 2.
(A) Alpha diversity, quantified by the observed species and Chao1 richness estimation; and (B) beta diversity, represented by Bray-Curtis based multidimensional scaling (MDS) analysis of caecal microbiota composition in male Sprague Dawley rats fed a diet supplemented with 0.1% (green), 0.2% (blue) MMB or a standard rat chow (red) (n = 10) for 6 weeks.

