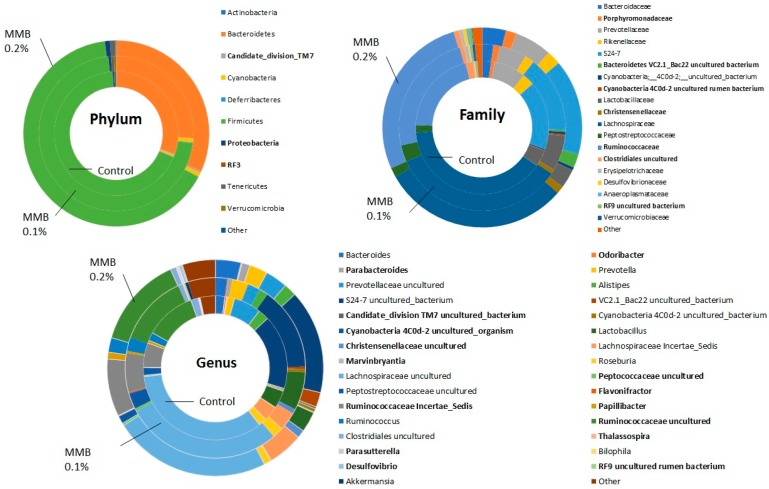
Figure 3.
Relative abundance of caecal microbiota communities at the (A) Phylum level, (B) Family level, and (C) Genus level in male Sprague Dawley rats fed with a diet supplemented with 0.1%, 0.2% MMB or a standard rat chow (n = 10) for 6 weeks. Only major taxonomic groups are shown. Significant differences are highlighted in bold. Statistical significance was accepted at p < 0.05. All p values were corrected for multiple comparisons using the Benjamini-Hochberg False Discovery Rate (pFDR).

