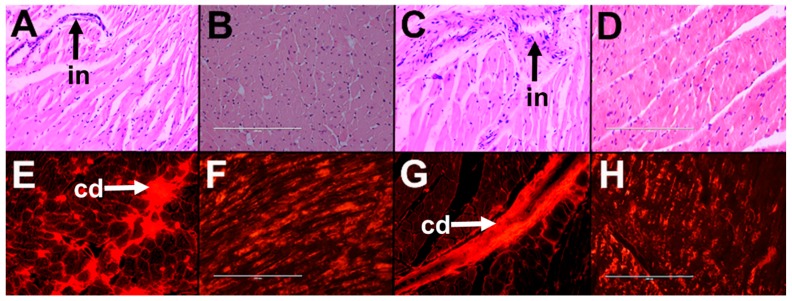
Figure 6.
Effects of Omacor on leuprolide-induced changes in the structure of the heart. Top row represents hematoxylin and eosin staining of left ventricle showing inflammatory cell infiltration (“in”, 20×) while the bottom row represents picrosirius red staining of left ventricle showing collagen deposition (“cd”, 40×) from leuprolide-treated rats fed corn starch diet (A,E); leuprolide-treated rats fed corn starch diet supplemented with Omacor (B,F); leuprolide-treated rats fed high-carbohydrate high-fat diet (C,G); and leuprolide-treated rats fed high-carbohydrate, high-fat diet supplemented with Omacor (D,H).

