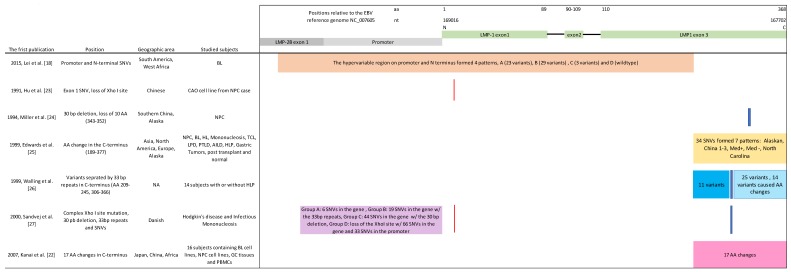
Figure 1.
A schematic representation of the LMP-1 promoter and coding region showing the relative positions of the variations in LMP-1 described and used in different studies to classify EBV LMP-1 genetic diversity (See reference number for first publication). Color shadows highlight the investigated regions or positions of each publication. Different color shades are used when the specific variations identified in the studied regions are different. Use of the same color shade at the same region, e.g., for variations in Hu et al [18] and Sandvej et al [27] indicate the same exact variation used in the two studies. The relative positions of the variations correspond to the illustration of the LMP-1 gene on the top.

