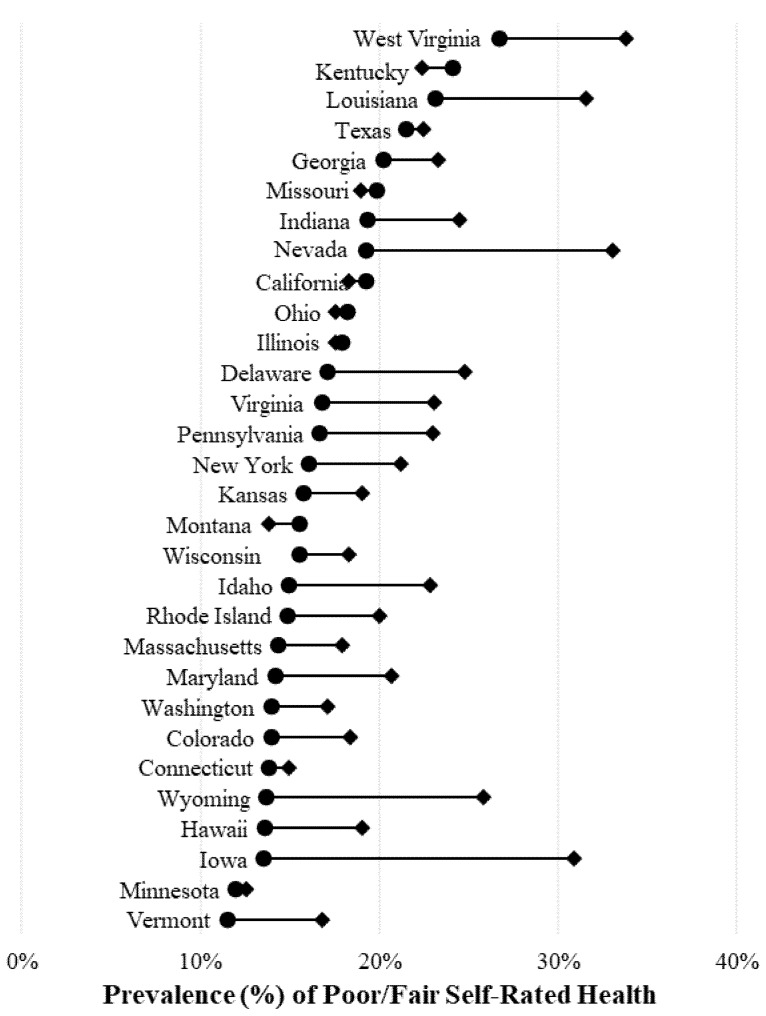
Figure 2.
State-specific estimates of poor or fair health by sexual minority status for women. Weighted estimates represent the percentage of adults aged 18 years and older who report poor or fair health (instead of excellent, very good, or good health). ● = heterosexual adults; ♦ = sexual minority adults. Source: 2014–2016 Behavioral Risk Factor Surveillance Survey. Note that not all states in the figure ascertained sexual orientation every year, but comparisons between heterosexual and sexual minority adults are state–year specific.

