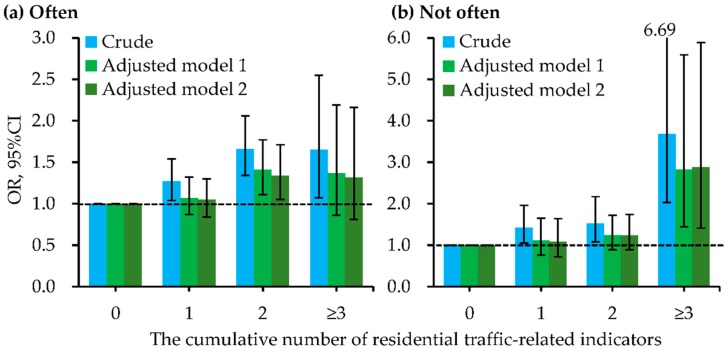
Figure 5.
Dose-response relationships of the cumulative number of indictors for residential traffic within 200 m of the residence with odds of childhood pneumonia, stratified by family habit of bedroom ventilation (often or not often open the bedroom windows during night). (a) Often; (b) Not often. Adjusted factors in model 1 (multivariate logistic regression analyses) included sex, age, residence-located area, family history of atopy, residence ownership, breastfeeding duration, household dampness-related exposures, household ETS, and household renovation during early lifetime. Adjusted factors in model 2 (two-level logistic regression analyses) included sex, age, family history of atopy, residence ownership, breastfeeding duration, household dampness-related exposures, household ETS, and household renovation during early lifetime. The supplemental Table S7 presented the detailed data for odds ratios (ORs) and their 95% confidence intervals (CIs). The p-values for interaction in crude model, adjusted model 1, and adjusted model 2 were 0.001, 0.065, and 0.051, respectively.

