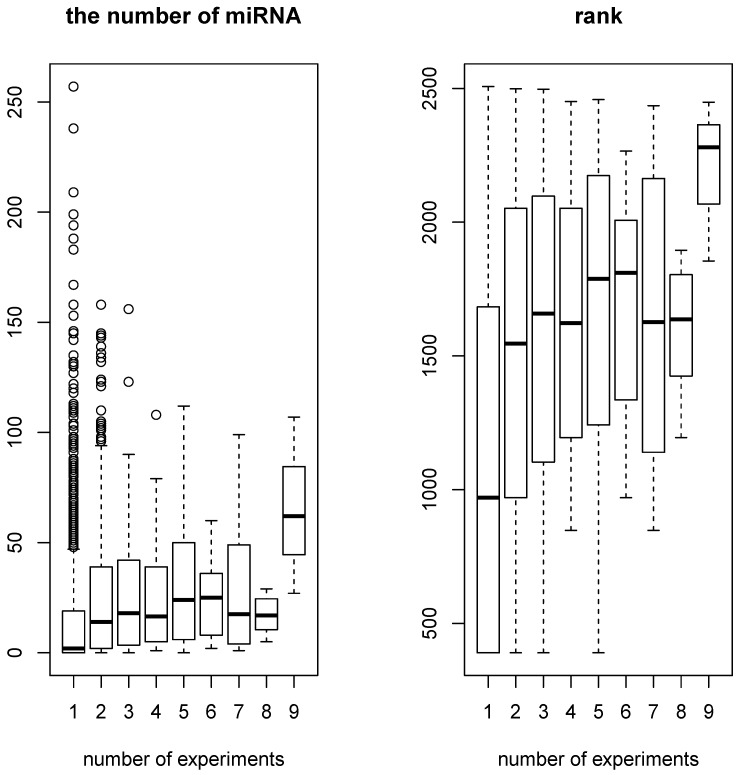
Figure 3.
A boxplot of the number of miRNAs that target individual genes as a function of the number of experiments that select individual genes within 11 experiments (most frequently selected genes were selected in nine experiments): (Left) raw numbers (Pearson’s correlation coefficient = 0.13, ); and (Right) ranks of numbers (Spearman’s correlation coefficient = 0.29, )

