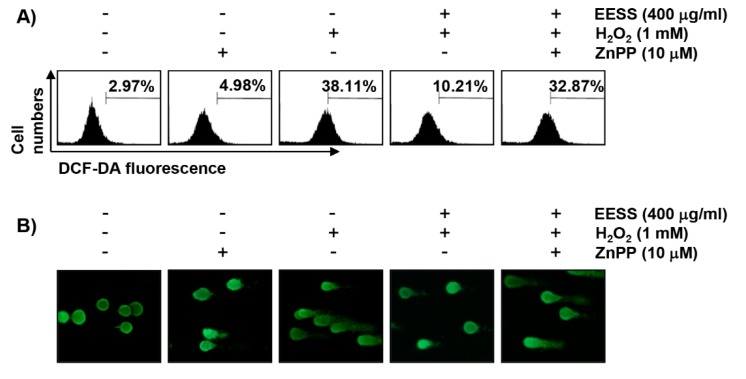
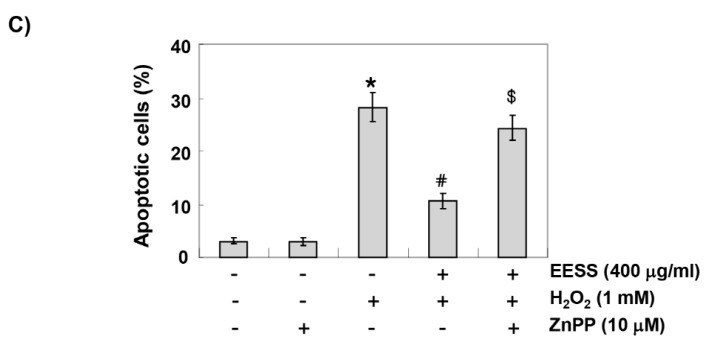
Figure 6.
Effects of EESS on H2O2-induced ROS generation, DNA damage, and apoptosis in SW1353 chondrocytes. The cells were pretreated for 1 h with 400 µg/mL EESS, and then treated for 24 h with or without 1 mM H2O2 in the absence or presence of 10 µM ZnPP. (A) After incubation with 10 µM JC-1 for 20 min, JC-1 fluorescence intensity was detected by flow cytometry. Each point represents the mean of two independent experiments; (B) The comet assay was performed to detect cellular DNA damage, and representative photographs of the comets were taken by fluorescence microscopy (original magnification, 200×); (C) To quantify the degree of apoptosis, the cells were stained with FITC-conjugated Annexin-V and PI for flow cytometry analysis. The data are represented as the means ± SD obtained from three independent experiments (* p < 0.05 compared with the control group; # p < 0.05 compared with the H2O2-treated group; $ p < 0.05 compared with H2O2 and the EESS-treated group).


