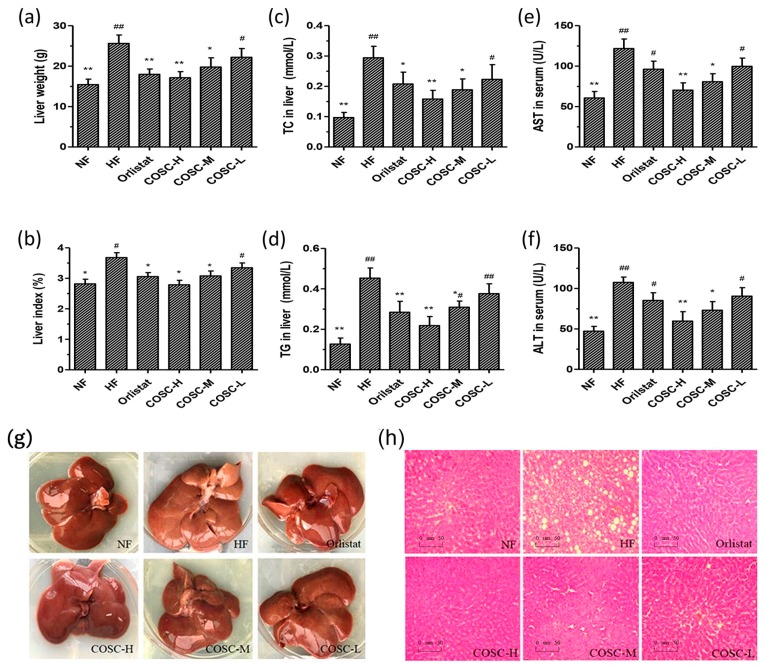
Figure 3.
COSCs regulated hepatic lipids and facilitate hepatoprotective effects for obese rats. Liver weight (a); liver index (b); liver TC (c) and TG (d); as well as serum AST (e) and ALT (f) are shown; The whole liver (g); and liver histopathological slices (h) (200×) in different groups are also presented. Tissue sections were stained with hematoxylin and eosin (H&E). The data are expressed as means ± SE (n = 10). Note: compared with rats in the HF group, * p < 0.05, ** p < 0.01; compared with rats in the NF group, # p < 0.05, ## p < 0.01.

