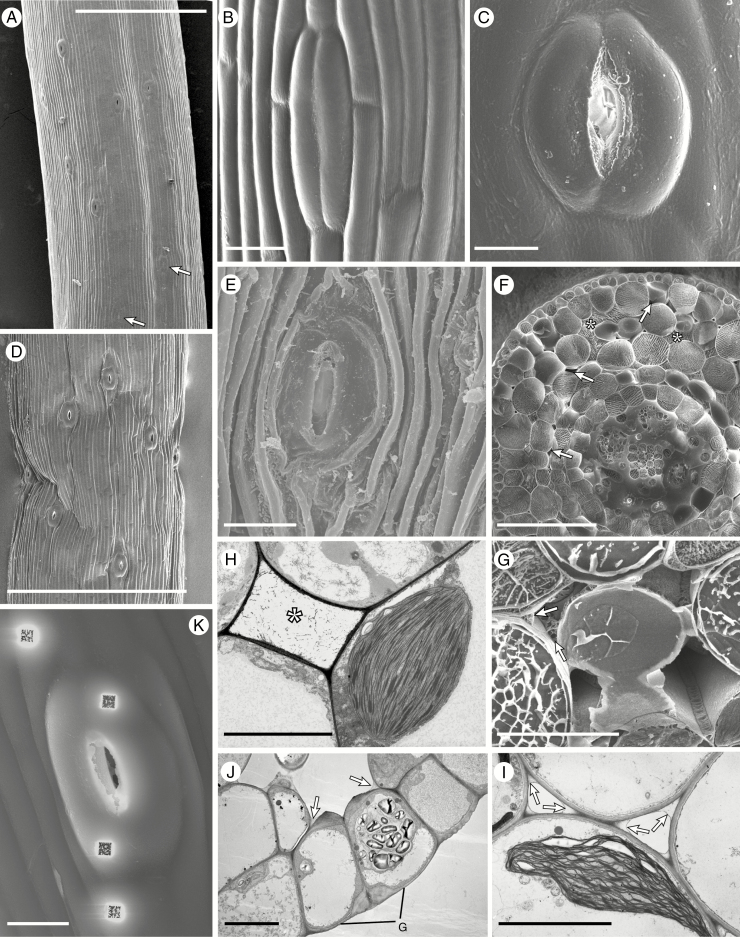
Fig. 1.
Cryo-scanning (A–G, K) and transmission (H–J) electron micrographs of Anthoceros punctatus (A–F), Phaeoceros laevis (G, J, K), Phaeomegaceros fimbriatus (H) and Folioceros fuciformis (I). (A) Portion of sporophyte just above the involucre with young stomata at the bottom (arrowed) and stomata with fully open apertures above. (B) Closed stoma with smooth walls. (C) Fully opened stoma. (D) Open stomata in a dehydrated sporophyte. (E) Stoma in the wall of a sporophyte well beyond the dehiscence point. (F) Cryo-fractured sporophyte with a mixture of liquid- (*) and gas-filled (arrowed) intercellular spaces. Note the liquid investing the developing spores and elaters. (G) Above the level where the stomata open the liquid is replaced by air, with liquid dried down to a thin layer lining the cell junctions (arrowed). (H, I) Liquid is also visible by TEM: (H) liquid-filled intercellular space (*) and (I) dried out liquid along the cell junctions in the assimilatory tissue (arrowed). (J) Section through stomatal guard cells; note the thickened inner and outer walls of the guard cells (G), the large starch-filled plastid and the dried down liquid in the corners of the intercellular spaces (arrowed). (K) An open stoma after ion milling. Scale bars: (A, D) 500 µm; (F) 100 µm; (B, C, E, J, K) 20 µm; (H, I) 10 µm.

